Immigrants from Russia vs Immigrants from Sweden Median Male Earnings
COMPARE
Immigrants from Russia
Immigrants from Sweden
Median Male Earnings
Median Male Earnings Comparison
Immigrants from Russia
Immigrants from Sweden
$63,326
MEDIAN MALE EARNINGS
100.0/ 100
METRIC RATING
34th/ 347
METRIC RANK
$65,406
MEDIAN MALE EARNINGS
100.0/ 100
METRIC RATING
21st/ 347
METRIC RANK
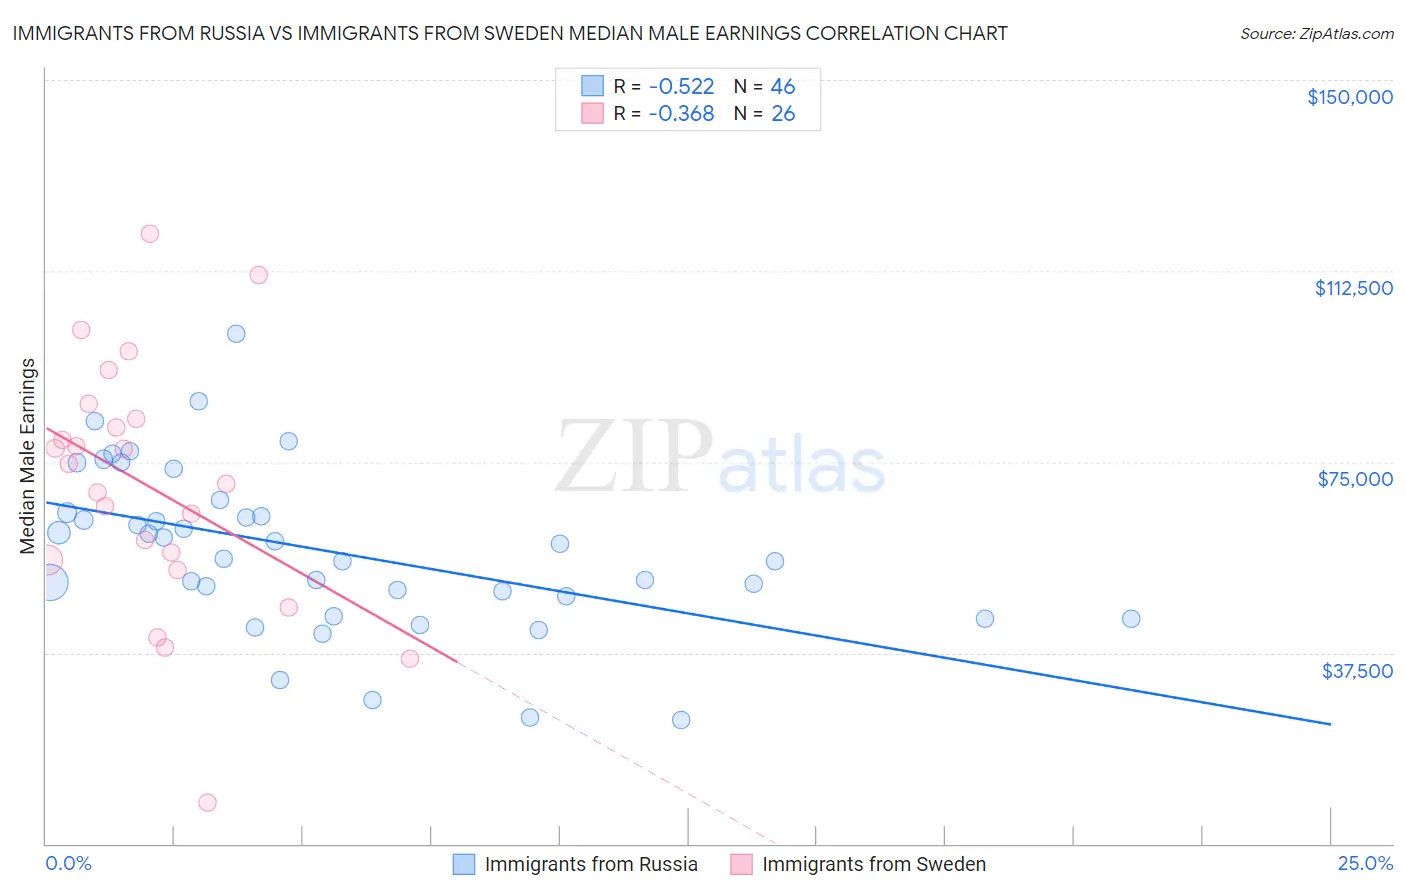
Immigrants from Russia vs Immigrants from Sweden Median Male Earnings Correlation Chart
The statistical analysis conducted on geographies consisting of 347,872,135 people shows a substantial negative correlation between the proportion of Immigrants from Russia and median male earnings in the United States with a correlation coefficient (R) of -0.522 and weighted average of $63,326. Similarly, the statistical analysis conducted on geographies consisting of 164,719,286 people shows a mild negative correlation between the proportion of Immigrants from Sweden and median male earnings in the United States with a correlation coefficient (R) of -0.368 and weighted average of $65,406, a difference of 3.3%.
Median Male Earnings Correlation Summary
| Measurement | Immigrants from Russia | Immigrants from Sweden |
| Minimum | $24,333 | $8,107 |
| Maximum | $100,126 | $119,732 |
| Range | $75,793 | $111,625 |
| Mean | $57,593 | $70,306 |
| Median | $57,441 | $72,770 |
| Interquartile 25% (IQ1) | $48,674 | $55,777 |
| Interquartile 75% (IQ3) | $65,019 | $83,429 |
| Interquartile Range (IQR) | $16,345 | $27,652 |
| Standard Deviation (Sample) | $16,130 | $24,867 |
| Standard Deviation (Population) | $15,954 | $24,384 |
Demographics Similar to Immigrants from Russia and Immigrants from Sweden by Median Male Earnings
In terms of median male earnings, the demographic groups most similar to Immigrants from Russia are Immigrants from Lithuania ($63,346, a difference of 0.030%), Soviet Union ($63,382, a difference of 0.090%), Immigrants from Asia ($63,240, a difference of 0.14%), Israeli ($63,228, a difference of 0.16%), and Latvian ($63,498, a difference of 0.27%). Similarly, the demographic groups most similar to Immigrants from Sweden are Immigrants from Japan ($65,518, a difference of 0.17%), Cypriot ($65,549, a difference of 0.22%), Burmese ($65,236, a difference of 0.26%), Immigrants from Korea ($65,079, a difference of 0.50%), and Immigrants from Northern Europe ($64,987, a difference of 0.65%).
| Demographics | Rating | Rank | Median Male Earnings |
| Immigrants | Belgium | 100.0 /100 | #17 | Exceptional $66,125 |
| Indians (Asian) | 100.0 /100 | #18 | Exceptional $66,078 |
| Cypriots | 100.0 /100 | #19 | Exceptional $65,549 |
| Immigrants | Japan | 100.0 /100 | #20 | Exceptional $65,518 |
| Immigrants | Sweden | 100.0 /100 | #21 | Exceptional $65,406 |
| Burmese | 100.0 /100 | #22 | Exceptional $65,236 |
| Immigrants | Korea | 100.0 /100 | #23 | Exceptional $65,079 |
| Immigrants | Northern Europe | 100.0 /100 | #24 | Exceptional $64,987 |
| Immigrants | Denmark | 100.0 /100 | #25 | Exceptional $64,625 |
| Turks | 100.0 /100 | #26 | Exceptional $64,253 |
| Immigrants | Switzerland | 100.0 /100 | #27 | Exceptional $63,944 |
| Russians | 100.0 /100 | #28 | Exceptional $63,939 |
| Asians | 100.0 /100 | #29 | Exceptional $63,827 |
| Immigrants | France | 100.0 /100 | #30 | Exceptional $63,715 |
| Latvians | 100.0 /100 | #31 | Exceptional $63,498 |
| Soviet Union | 100.0 /100 | #32 | Exceptional $63,382 |
| Immigrants | Lithuania | 100.0 /100 | #33 | Exceptional $63,346 |
| Immigrants | Russia | 100.0 /100 | #34 | Exceptional $63,326 |
| Immigrants | Asia | 100.0 /100 | #35 | Exceptional $63,240 |
| Israelis | 100.0 /100 | #36 | Exceptional $63,228 |
| Immigrants | Sri Lanka | 100.0 /100 | #37 | Exceptional $63,099 |