Immigrants from Cameroon vs Haitian Median Family Income
COMPARE
Immigrants from Cameroon
Haitian
Median Family Income
Median Family Income Comparison
Immigrants from Cameroon
Haitians
$100,289
MEDIAN FAMILY INCOME
22.8/ 100
METRIC RATING
197th/ 347
METRIC RANK
$85,218
MEDIAN FAMILY INCOME
0.0/ 100
METRIC RATING
309th/ 347
METRIC RANK
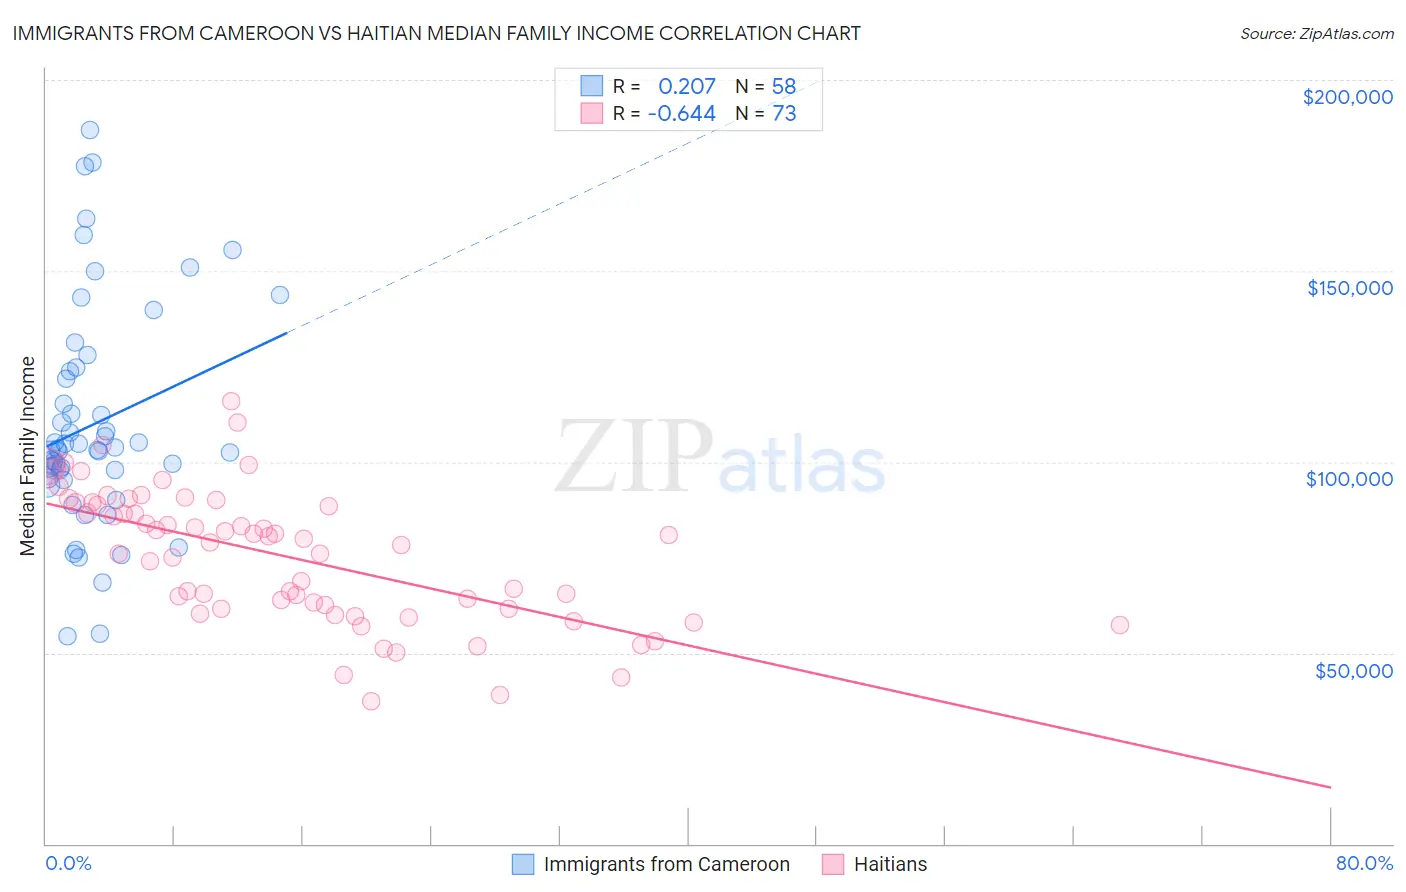
Immigrants from Cameroon vs Haitian Median Family Income Correlation Chart
The statistical analysis conducted on geographies consisting of 130,726,829 people shows a weak positive correlation between the proportion of Immigrants from Cameroon and median family income in the United States with a correlation coefficient (R) of 0.207 and weighted average of $100,289. Similarly, the statistical analysis conducted on geographies consisting of 287,578,429 people shows a significant negative correlation between the proportion of Haitians and median family income in the United States with a correlation coefficient (R) of -0.644 and weighted average of $85,218, a difference of 17.7%.
Median Family Income Correlation Summary
| Measurement | Immigrants from Cameroon | Haitian |
| Minimum | $54,178 | $37,244 |
| Maximum | $186,802 | $115,792 |
| Range | $132,624 | $78,548 |
| Mean | $109,949 | $75,276 |
| Median | $103,317 | $79,021 |
| Interquartile 25% (IQ1) | $95,592 | $61,587 |
| Interquartile 75% (IQ3) | $123,784 | $88,995 |
| Interquartile Range (IQR) | $28,192 | $27,408 |
| Standard Deviation (Sample) | $29,032 | $17,405 |
| Standard Deviation (Population) | $28,780 | $17,285 |
Similar Demographics by Median Family Income
Demographics Similar to Immigrants from Cameroon by Median Family Income
In terms of median family income, the demographic groups most similar to Immigrants from Cameroon are Immigrants from Africa ($100,256, a difference of 0.030%), Samoan ($100,344, a difference of 0.060%), Immigrants from South America ($100,414, a difference of 0.12%), Yugoslavian ($100,119, a difference of 0.17%), and Spanish ($99,977, a difference of 0.31%).
| Demographics | Rating | Rank | Median Family Income |
| Immigrants | Immigrants | 29.4 /100 | #190 | Fair $100,962 |
| Colombians | 27.2 /100 | #191 | Fair $100,750 |
| Immigrants | Kenya | 26.5 /100 | #192 | Fair $100,679 |
| Iraqis | 26.3 /100 | #193 | Fair $100,658 |
| Uruguayans | 26.3 /100 | #194 | Fair $100,656 |
| Immigrants | South America | 23.9 /100 | #195 | Fair $100,414 |
| Samoans | 23.3 /100 | #196 | Fair $100,344 |
| Immigrants | Cameroon | 22.8 /100 | #197 | Fair $100,289 |
| Immigrants | Africa | 22.5 /100 | #198 | Fair $100,256 |
| Yugoslavians | 21.3 /100 | #199 | Fair $100,119 |
| Spanish | 20.1 /100 | #200 | Fair $99,977 |
| Immigrants | Thailand | 19.0 /100 | #201 | Poor $99,840 |
| Whites/Caucasians | 18.7 /100 | #202 | Poor $99,800 |
| Scotch-Irish | 17.1 /100 | #203 | Poor $99,591 |
| Ghanaians | 12.6 /100 | #204 | Poor $98,877 |
Demographics Similar to Haitians by Median Family Income
In terms of median family income, the demographic groups most similar to Haitians are U.S. Virgin Islander ($85,294, a difference of 0.090%), Chickasaw ($85,356, a difference of 0.16%), Immigrants from Central America ($85,050, a difference of 0.20%), Paiute ($85,414, a difference of 0.23%), and Immigrants from Dominica ($85,411, a difference of 0.23%).
| Demographics | Rating | Rank | Median Family Income |
| Spanish American Indians | 0.0 /100 | #302 | Tragic $85,728 |
| Hispanics or Latinos | 0.0 /100 | #303 | Tragic $85,647 |
| Mexicans | 0.0 /100 | #304 | Tragic $85,618 |
| Paiute | 0.0 /100 | #305 | Tragic $85,414 |
| Immigrants | Dominica | 0.0 /100 | #306 | Tragic $85,411 |
| Chickasaw | 0.0 /100 | #307 | Tragic $85,356 |
| U.S. Virgin Islanders | 0.0 /100 | #308 | Tragic $85,294 |
| Haitians | 0.0 /100 | #309 | Tragic $85,218 |
| Immigrants | Central America | 0.0 /100 | #310 | Tragic $85,050 |
| Hondurans | 0.0 /100 | #311 | Tragic $85,004 |
| Cubans | 0.0 /100 | #312 | Tragic $84,981 |
| Choctaw | 0.0 /100 | #313 | Tragic $84,835 |
| Immigrants | Bahamas | 0.0 /100 | #314 | Tragic $84,732 |
| Apache | 0.0 /100 | #315 | Tragic $84,451 |
| Immigrants | Haiti | 0.0 /100 | #316 | Tragic $84,018 |