Blackfeet vs Slavic Median Male Earnings
COMPARE
Blackfeet
Slavic
Median Male Earnings
Median Male Earnings Comparison
Blackfeet
Slavs
$48,402
MEDIAN MALE EARNINGS
0.3/ 100
METRIC RATING
276th/ 347
METRIC RANK
$56,390
MEDIAN MALE EARNINGS
86.5/ 100
METRIC RATING
137th/ 347
METRIC RANK
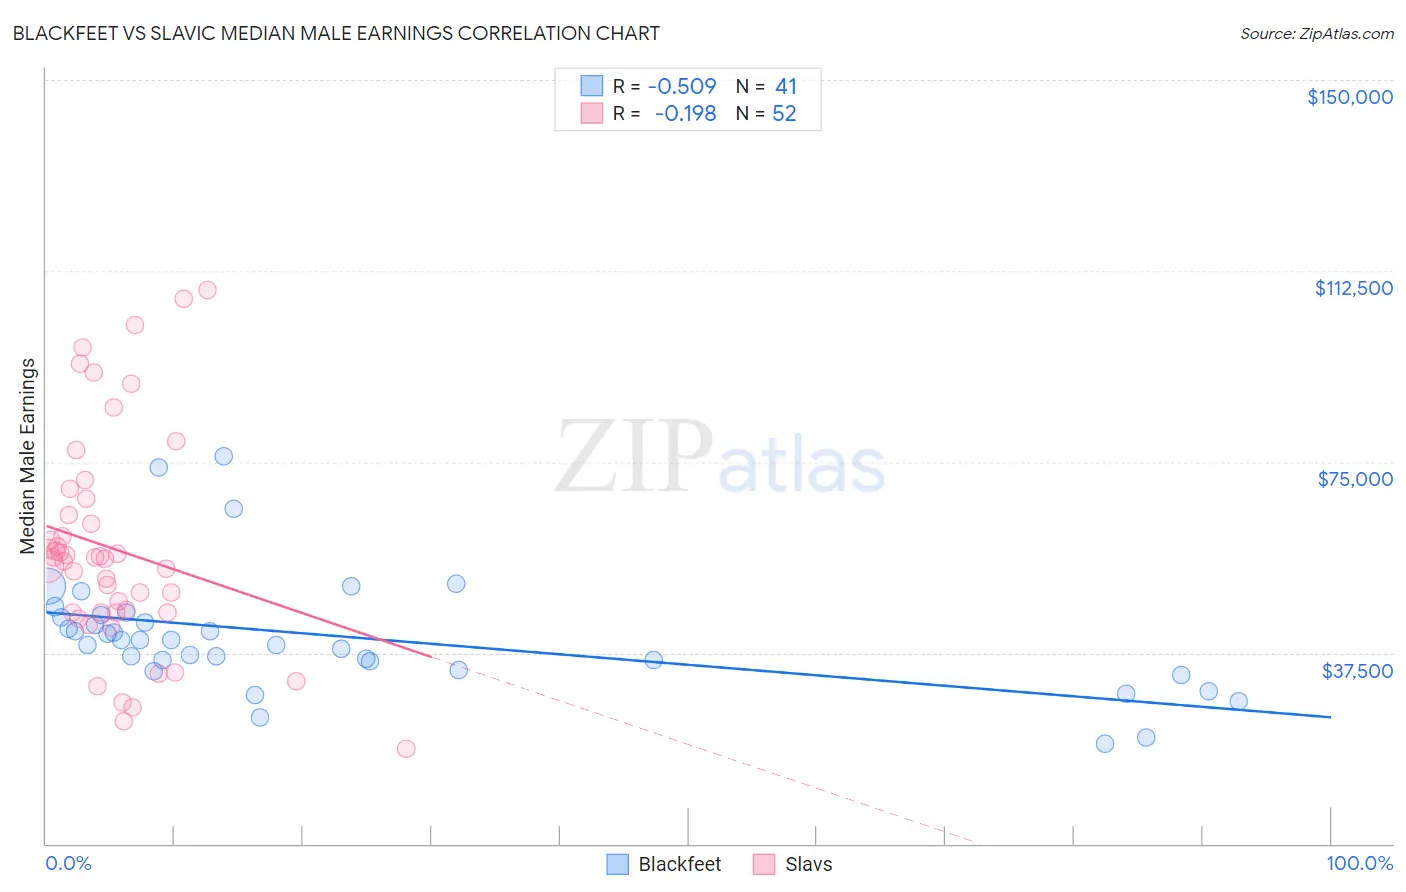
Blackfeet vs Slavic Median Male Earnings Correlation Chart
The statistical analysis conducted on geographies consisting of 309,464,268 people shows a substantial negative correlation between the proportion of Blackfeet and median male earnings in the United States with a correlation coefficient (R) of -0.509 and weighted average of $48,402. Similarly, the statistical analysis conducted on geographies consisting of 270,818,256 people shows a poor negative correlation between the proportion of Slavs and median male earnings in the United States with a correlation coefficient (R) of -0.198 and weighted average of $56,390, a difference of 16.5%.
Median Male Earnings Correlation Summary
| Measurement | Blackfeet | Slavic |
| Minimum | $19,559 | $18,676 |
| Maximum | $76,032 | $108,806 |
| Range | $56,473 | $90,130 |
| Mean | $40,687 | $57,922 |
| Median | $39,915 | $56,132 |
| Interquartile 25% (IQ1) | $35,022 | $45,442 |
| Interquartile 75% (IQ3) | $44,674 | $66,210 |
| Interquartile Range (IQR) | $9,652 | $20,768 |
| Standard Deviation (Sample) | $11,608 | $21,311 |
| Standard Deviation (Population) | $11,465 | $21,105 |
Similar Demographics by Median Male Earnings
Demographics Similar to Blackfeet by Median Male Earnings
In terms of median male earnings, the demographic groups most similar to Blackfeet are Immigrants from Somalia ($48,439, a difference of 0.080%), Belizean ($48,358, a difference of 0.090%), Immigrants from Liberia ($48,317, a difference of 0.18%), Colville ($48,516, a difference of 0.24%), and Hmong ($48,254, a difference of 0.31%).
| Demographics | Rating | Rank | Median Male Earnings |
| Tsimshian | 0.4 /100 | #269 | Tragic $48,836 |
| Potawatomi | 0.4 /100 | #270 | Tragic $48,768 |
| Cherokee | 0.3 /100 | #271 | Tragic $48,669 |
| Salvadorans | 0.3 /100 | #272 | Tragic $48,646 |
| Jamaicans | 0.3 /100 | #273 | Tragic $48,632 |
| Colville | 0.3 /100 | #274 | Tragic $48,516 |
| Immigrants | Somalia | 0.3 /100 | #275 | Tragic $48,439 |
| Blackfeet | 0.3 /100 | #276 | Tragic $48,402 |
| Belizeans | 0.2 /100 | #277 | Tragic $48,358 |
| Immigrants | Liberia | 0.2 /100 | #278 | Tragic $48,317 |
| Hmong | 0.2 /100 | #279 | Tragic $48,254 |
| Comanche | 0.2 /100 | #280 | Tragic $48,202 |
| Marshallese | 0.2 /100 | #281 | Tragic $48,137 |
| Central Americans | 0.2 /100 | #282 | Tragic $48,093 |
| Immigrants | Jamaica | 0.2 /100 | #283 | Tragic $48,040 |
Demographics Similar to Slavs by Median Male Earnings
In terms of median male earnings, the demographic groups most similar to Slavs are Immigrants from Saudi Arabia ($56,452, a difference of 0.11%), Irish ($56,464, a difference of 0.13%), Slovak ($56,306, a difference of 0.15%), Zimbabwean ($56,302, a difference of 0.16%), and Luxembourger ($56,300, a difference of 0.16%).
| Demographics | Rating | Rank | Median Male Earnings |
| Koreans | 89.4 /100 | #130 | Excellent $56,672 |
| Portuguese | 89.4 /100 | #131 | Excellent $56,663 |
| Czechs | 88.2 /100 | #132 | Excellent $56,546 |
| Immigrants | Germany | 88.2 /100 | #133 | Excellent $56,542 |
| Moroccans | 87.7 /100 | #134 | Excellent $56,499 |
| Irish | 87.4 /100 | #135 | Excellent $56,464 |
| Immigrants | Saudi Arabia | 87.2 /100 | #136 | Excellent $56,452 |
| Slavs | 86.5 /100 | #137 | Excellent $56,390 |
| Slovaks | 85.5 /100 | #138 | Excellent $56,306 |
| Zimbabweans | 85.5 /100 | #139 | Excellent $56,302 |
| Luxembourgers | 85.5 /100 | #140 | Excellent $56,300 |
| Danes | 84.8 /100 | #141 | Excellent $56,246 |
| Ethiopians | 84.8 /100 | #142 | Excellent $56,243 |
| Sri Lankans | 83.4 /100 | #143 | Excellent $56,136 |
| Immigrants | Uganda | 82.4 /100 | #144 | Excellent $56,064 |