Apache vs Basque Median Male Earnings
COMPARE
Apache
Basque
Median Male Earnings
Median Male Earnings Comparison
Apache
Basques
$46,429
MEDIAN MALE EARNINGS
0.0/ 100
METRIC RATING
311th/ 347
METRIC RANK
$55,370
MEDIAN MALE EARNINGS
70.3/ 100
METRIC RATING
160th/ 347
METRIC RANK
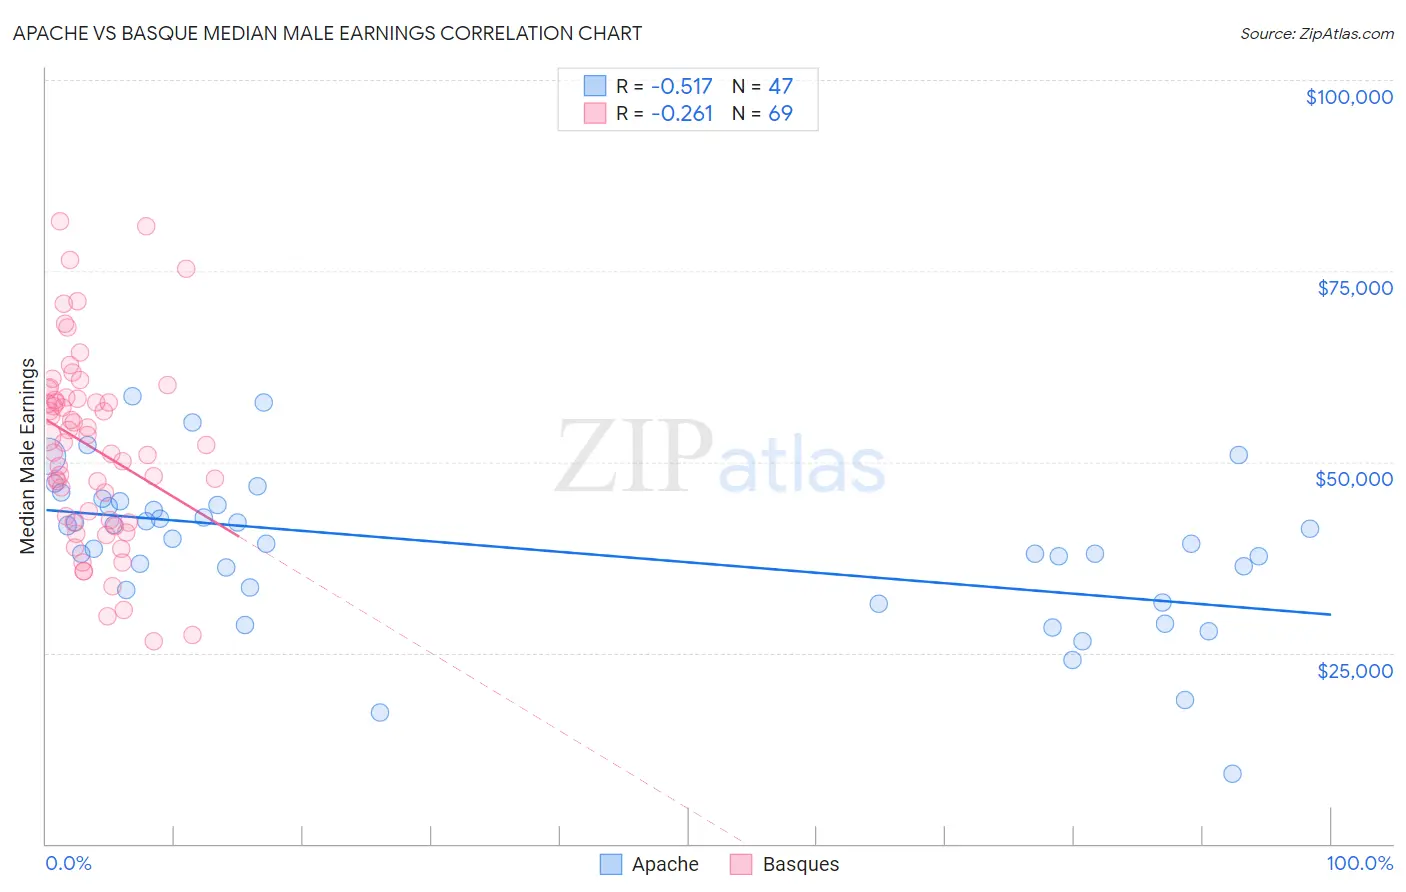
Apache vs Basque Median Male Earnings Correlation Chart
The statistical analysis conducted on geographies consisting of 231,058,501 people shows a substantial negative correlation between the proportion of Apache and median male earnings in the United States with a correlation coefficient (R) of -0.517 and weighted average of $46,429. Similarly, the statistical analysis conducted on geographies consisting of 165,750,902 people shows a weak negative correlation between the proportion of Basques and median male earnings in the United States with a correlation coefficient (R) of -0.261 and weighted average of $55,370, a difference of 19.3%.
Median Male Earnings Correlation Summary
| Measurement | Apache | Basque |
| Minimum | $9,161 | $26,442 |
| Maximum | $58,566 | $81,428 |
| Range | $49,405 | $54,986 |
| Mean | $38,686 | $51,886 |
| Median | $39,318 | $52,492 |
| Interquartile 25% (IQ1) | $33,190 | $42,224 |
| Interquartile 75% (IQ3) | $44,375 | $58,280 |
| Interquartile Range (IQR) | $11,185 | $16,056 |
| Standard Deviation (Sample) | $10,062 | $12,223 |
| Standard Deviation (Population) | $9,955 | $12,134 |
Similar Demographics by Median Male Earnings
Demographics Similar to Apache by Median Male Earnings
In terms of median male earnings, the demographic groups most similar to Apache are Hispanic or Latino ($46,419, a difference of 0.020%), Honduran ($46,374, a difference of 0.12%), Chippewa ($46,368, a difference of 0.13%), Cuban ($46,580, a difference of 0.33%), and Creek ($46,594, a difference of 0.36%).
| Demographics | Rating | Rank | Median Male Earnings |
| Bangladeshis | 0.1 /100 | #304 | Tragic $46,744 |
| Guatemalans | 0.0 /100 | #305 | Tragic $46,736 |
| Dutch West Indians | 0.0 /100 | #306 | Tragic $46,656 |
| Immigrants | Dominican Republic | 0.0 /100 | #307 | Tragic $46,655 |
| Ottawa | 0.0 /100 | #308 | Tragic $46,611 |
| Creek | 0.0 /100 | #309 | Tragic $46,594 |
| Cubans | 0.0 /100 | #310 | Tragic $46,580 |
| Apache | 0.0 /100 | #311 | Tragic $46,429 |
| Hispanics or Latinos | 0.0 /100 | #312 | Tragic $46,419 |
| Hondurans | 0.0 /100 | #313 | Tragic $46,374 |
| Chippewa | 0.0 /100 | #314 | Tragic $46,368 |
| Immigrants | Guatemala | 0.0 /100 | #315 | Tragic $46,244 |
| Immigrants | Caribbean | 0.0 /100 | #316 | Tragic $46,193 |
| Mexicans | 0.0 /100 | #317 | Tragic $46,147 |
| Cheyenne | 0.0 /100 | #318 | Tragic $46,062 |
Demographics Similar to Basques by Median Male Earnings
In terms of median male earnings, the demographic groups most similar to Basques are Czechoslovakian ($55,382, a difference of 0.020%), Alsatian ($55,380, a difference of 0.020%), Belgian ($55,361, a difference of 0.020%), French ($55,350, a difference of 0.040%), and Icelander ($55,415, a difference of 0.080%).
| Demographics | Rating | Rank | Median Male Earnings |
| Immigrants | Nepal | 75.0 /100 | #153 | Good $55,615 |
| Taiwanese | 73.9 /100 | #154 | Good $55,556 |
| Scandinavians | 73.4 /100 | #155 | Good $55,527 |
| Immigrants | Ethiopia | 71.6 /100 | #156 | Good $55,434 |
| Icelanders | 71.2 /100 | #157 | Good $55,415 |
| Czechoslovakians | 70.5 /100 | #158 | Good $55,382 |
| Alsatians | 70.5 /100 | #159 | Good $55,380 |
| Basques | 70.3 /100 | #160 | Good $55,370 |
| Belgians | 70.1 /100 | #161 | Good $55,361 |
| French | 69.9 /100 | #162 | Good $55,350 |
| Ugandans | 68.6 /100 | #163 | Good $55,290 |
| Immigrants | South Eastern Asia | 67.6 /100 | #164 | Good $55,241 |
| Immigrants | Portugal | 66.3 /100 | #165 | Good $55,182 |
| Germans | 61.6 /100 | #166 | Good $54,974 |
| Immigrants | Fiji | 61.2 /100 | #167 | Good $54,958 |