Immigrants from Eastern Asia vs Basque Median Male Earnings
COMPARE
Immigrants from Eastern Asia
Basque
Median Male Earnings
Median Male Earnings Comparison
Immigrants from Eastern Asia
Basques
$66,903
MEDIAN MALE EARNINGS
100.0/ 100
METRIC RATING
15th/ 347
METRIC RANK
$55,370
MEDIAN MALE EARNINGS
70.3/ 100
METRIC RATING
160th/ 347
METRIC RANK
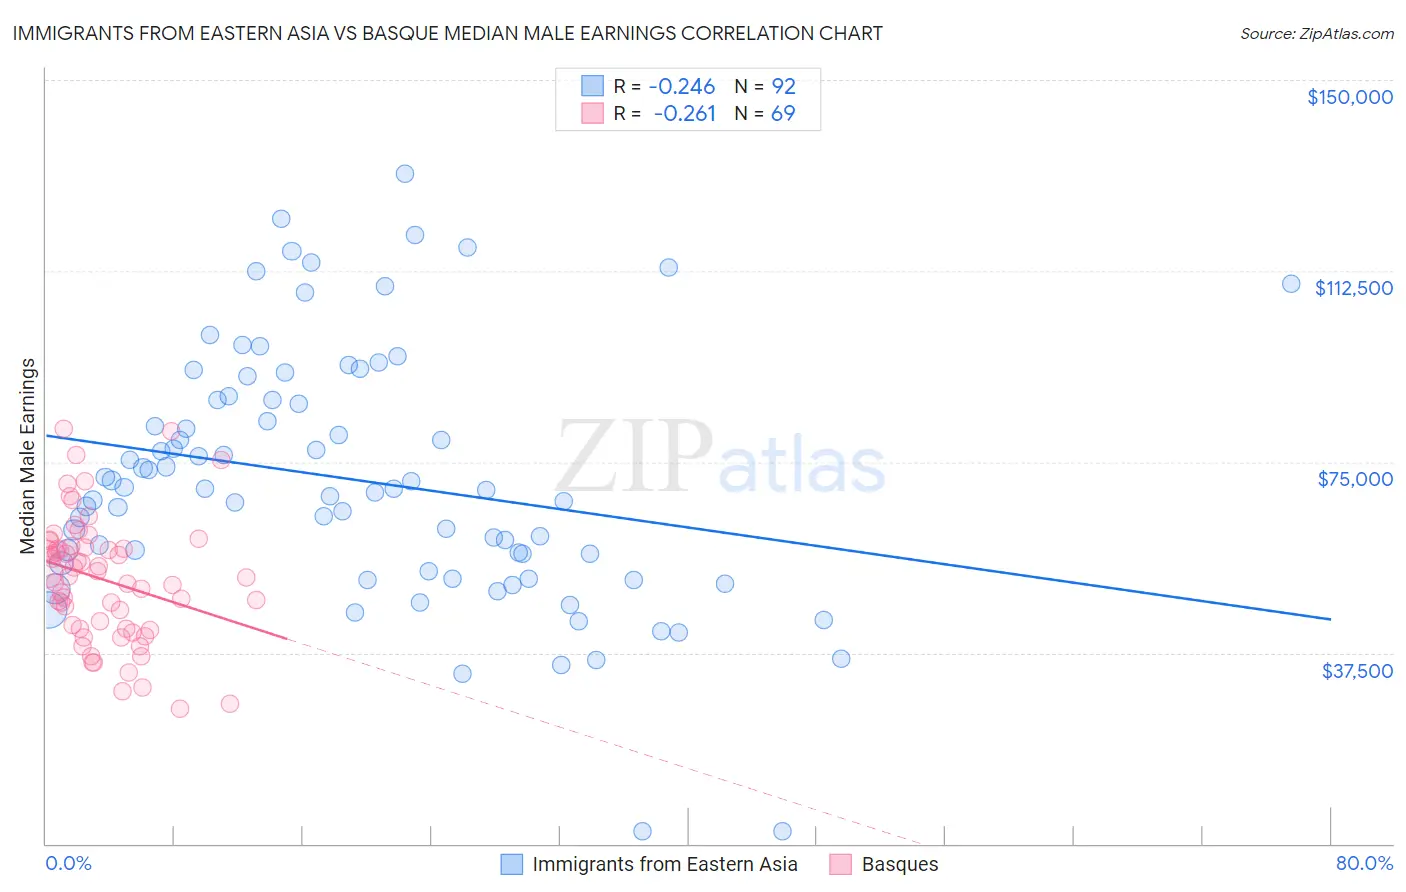
Immigrants from Eastern Asia vs Basque Median Male Earnings Correlation Chart
The statistical analysis conducted on geographies consisting of 499,639,394 people shows a weak negative correlation between the proportion of Immigrants from Eastern Asia and median male earnings in the United States with a correlation coefficient (R) of -0.246 and weighted average of $66,903. Similarly, the statistical analysis conducted on geographies consisting of 165,750,902 people shows a weak negative correlation between the proportion of Basques and median male earnings in the United States with a correlation coefficient (R) of -0.261 and weighted average of $55,370, a difference of 20.8%.
Median Male Earnings Correlation Summary
| Measurement | Immigrants from Eastern Asia | Basque |
| Minimum | $2,499 | $26,442 |
| Maximum | $131,653 | $81,428 |
| Range | $129,154 | $54,986 |
| Mean | $71,397 | $51,886 |
| Median | $69,591 | $52,492 |
| Interquartile 25% (IQ1) | $54,279 | $42,224 |
| Interquartile 75% (IQ3) | $87,124 | $58,280 |
| Interquartile Range (IQR) | $32,845 | $16,056 |
| Standard Deviation (Sample) | $24,831 | $12,223 |
| Standard Deviation (Population) | $24,695 | $12,134 |
Similar Demographics by Median Male Earnings
Demographics Similar to Immigrants from Eastern Asia by Median Male Earnings
In terms of median male earnings, the demographic groups most similar to Immigrants from Eastern Asia are Okinawan ($67,232, a difference of 0.49%), Eastern European ($66,472, a difference of 0.65%), Immigrants from China ($67,353, a difference of 0.67%), Immigrants from Australia ($67,634, a difference of 1.1%), and Immigrants from Belgium ($66,125, a difference of 1.2%).
| Demographics | Rating | Rank | Median Male Earnings |
| Immigrants | Iran | 100.0 /100 | #8 | Exceptional $69,284 |
| Immigrants | South Central Asia | 100.0 /100 | #9 | Exceptional $68,960 |
| Immigrants | Israel | 100.0 /100 | #10 | Exceptional $68,716 |
| Immigrants | Ireland | 100.0 /100 | #11 | Exceptional $67,698 |
| Immigrants | Australia | 100.0 /100 | #12 | Exceptional $67,634 |
| Immigrants | China | 100.0 /100 | #13 | Exceptional $67,353 |
| Okinawans | 100.0 /100 | #14 | Exceptional $67,232 |
| Immigrants | Eastern Asia | 100.0 /100 | #15 | Exceptional $66,903 |
| Eastern Europeans | 100.0 /100 | #16 | Exceptional $66,472 |
| Immigrants | Belgium | 100.0 /100 | #17 | Exceptional $66,125 |
| Indians (Asian) | 100.0 /100 | #18 | Exceptional $66,078 |
| Cypriots | 100.0 /100 | #19 | Exceptional $65,549 |
| Immigrants | Japan | 100.0 /100 | #20 | Exceptional $65,518 |
| Immigrants | Sweden | 100.0 /100 | #21 | Exceptional $65,406 |
| Burmese | 100.0 /100 | #22 | Exceptional $65,236 |
Demographics Similar to Basques by Median Male Earnings
In terms of median male earnings, the demographic groups most similar to Basques are Czechoslovakian ($55,382, a difference of 0.020%), Alsatian ($55,380, a difference of 0.020%), Belgian ($55,361, a difference of 0.020%), French ($55,350, a difference of 0.040%), and Icelander ($55,415, a difference of 0.080%).
| Demographics | Rating | Rank | Median Male Earnings |
| Immigrants | Nepal | 75.0 /100 | #153 | Good $55,615 |
| Taiwanese | 73.9 /100 | #154 | Good $55,556 |
| Scandinavians | 73.4 /100 | #155 | Good $55,527 |
| Immigrants | Ethiopia | 71.6 /100 | #156 | Good $55,434 |
| Icelanders | 71.2 /100 | #157 | Good $55,415 |
| Czechoslovakians | 70.5 /100 | #158 | Good $55,382 |
| Alsatians | 70.5 /100 | #159 | Good $55,380 |
| Basques | 70.3 /100 | #160 | Good $55,370 |
| Belgians | 70.1 /100 | #161 | Good $55,361 |
| French | 69.9 /100 | #162 | Good $55,350 |
| Ugandans | 68.6 /100 | #163 | Good $55,290 |
| Immigrants | South Eastern Asia | 67.6 /100 | #164 | Good $55,241 |
| Immigrants | Portugal | 66.3 /100 | #165 | Good $55,182 |
| Germans | 61.6 /100 | #166 | Good $54,974 |
| Immigrants | Fiji | 61.2 /100 | #167 | Good $54,958 |