Israeli vs Immigrants from Morocco Median Family Income
COMPARE
Israeli
Immigrants from Morocco
Median Family Income
Median Family Income Comparison
Israelis
Immigrants from Morocco
$118,577
MEDIAN FAMILY INCOME
100.0/ 100
METRIC RATING
36th/ 347
METRIC RANK
$105,964
MEDIAN FAMILY INCOME
84.3/ 100
METRIC RATING
144th/ 347
METRIC RANK
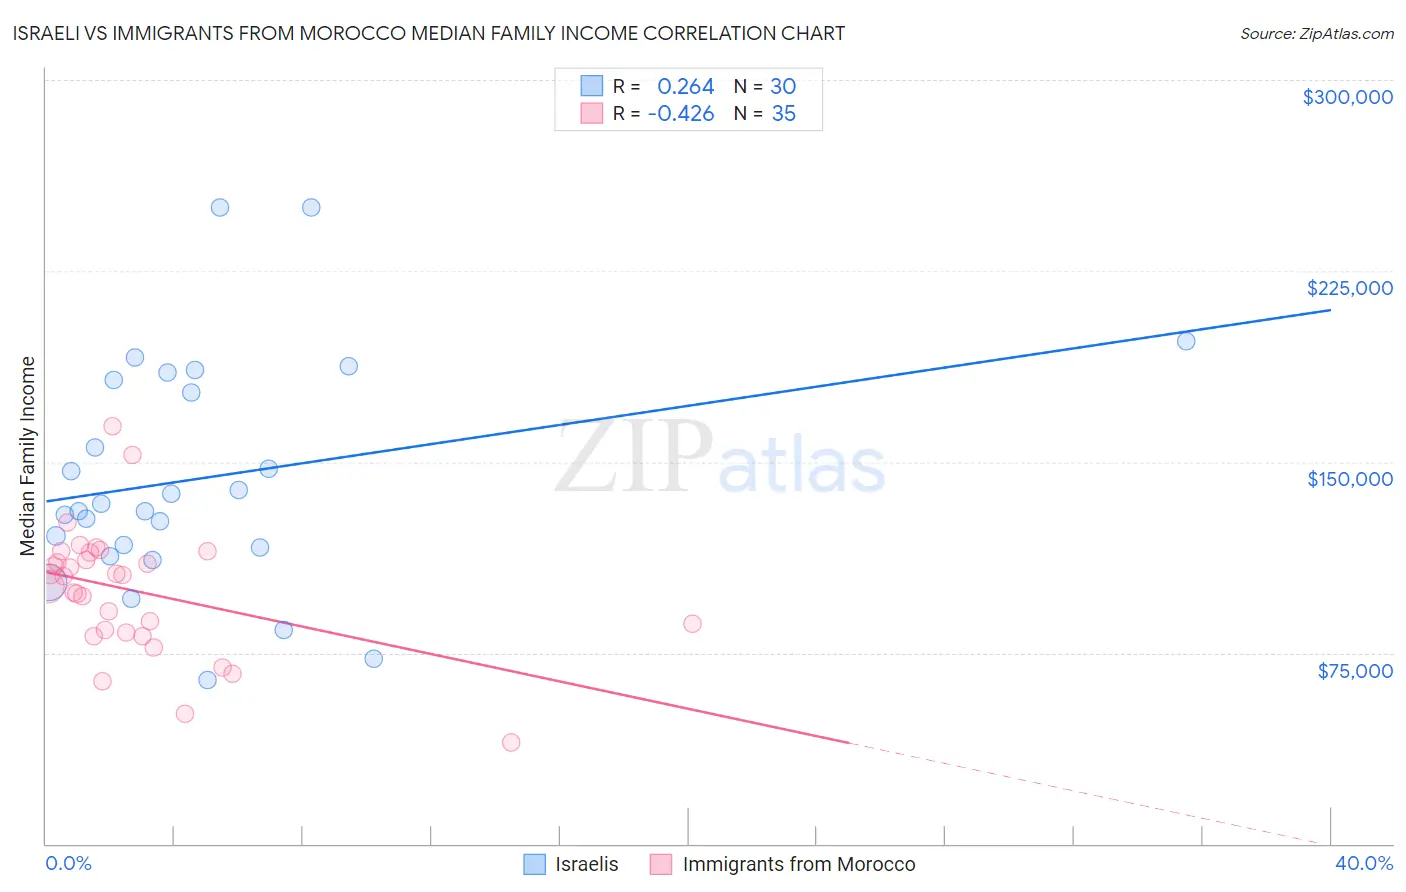
Israeli vs Immigrants from Morocco Median Family Income Correlation Chart
The statistical analysis conducted on geographies consisting of 210,932,899 people shows a weak positive correlation between the proportion of Israelis and median family income in the United States with a correlation coefficient (R) of 0.264 and weighted average of $118,577. Similarly, the statistical analysis conducted on geographies consisting of 178,905,802 people shows a moderate negative correlation between the proportion of Immigrants from Morocco and median family income in the United States with a correlation coefficient (R) of -0.426 and weighted average of $105,964, a difference of 11.9%.
Median Family Income Correlation Summary
| Measurement | Israeli | Immigrants from Morocco |
| Minimum | $64,441 | $39,712 |
| Maximum | $250,001 | $163,880 |
| Range | $185,560 | $124,168 |
| Mean | $143,645 | $99,080 |
| Median | $132,084 | $105,156 |
| Interquartile 25% (IQ1) | $116,332 | $82,830 |
| Interquartile 75% (IQ3) | $182,189 | $114,323 |
| Interquartile Range (IQR) | $65,857 | $31,493 |
| Standard Deviation (Sample) | $45,469 | $24,961 |
| Standard Deviation (Population) | $44,705 | $24,602 |
Similar Demographics by Median Family Income
Demographics Similar to Israelis by Median Family Income
In terms of median family income, the demographic groups most similar to Israelis are Australian ($118,440, a difference of 0.12%), Immigrants from Turkey ($118,325, a difference of 0.21%), Immigrants from Asia ($118,291, a difference of 0.24%), Immigrants from Lithuania ($118,053, a difference of 0.44%), and Estonian ($118,013, a difference of 0.48%).
| Demographics | Rating | Rank | Median Family Income |
| Latvians | 100.0 /100 | #29 | Exceptional $120,301 |
| Immigrants | Sri Lanka | 100.0 /100 | #30 | Exceptional $120,263 |
| Immigrants | France | 100.0 /100 | #31 | Exceptional $120,076 |
| Asians | 100.0 /100 | #32 | Exceptional $119,955 |
| Bhutanese | 100.0 /100 | #33 | Exceptional $119,800 |
| Bolivians | 100.0 /100 | #34 | Exceptional $119,479 |
| Soviet Union | 100.0 /100 | #35 | Exceptional $119,262 |
| Israelis | 100.0 /100 | #36 | Exceptional $118,577 |
| Australians | 100.0 /100 | #37 | Exceptional $118,440 |
| Immigrants | Turkey | 100.0 /100 | #38 | Exceptional $118,325 |
| Immigrants | Asia | 100.0 /100 | #39 | Exceptional $118,291 |
| Immigrants | Lithuania | 100.0 /100 | #40 | Exceptional $118,053 |
| Estonians | 100.0 /100 | #41 | Exceptional $118,013 |
| Immigrants | Bolivia | 100.0 /100 | #42 | Exceptional $117,912 |
| Bulgarians | 100.0 /100 | #43 | Exceptional $117,818 |
Demographics Similar to Immigrants from Morocco by Median Family Income
In terms of median family income, the demographic groups most similar to Immigrants from Morocco are Tongan ($105,967, a difference of 0.0%), Slovene ($106,020, a difference of 0.050%), Danish ($105,900, a difference of 0.060%), Czech ($105,839, a difference of 0.12%), and Immigrants from Syria ($106,118, a difference of 0.15%).
| Demographics | Rating | Rank | Median Family Income |
| Immigrants | Uganda | 85.7 /100 | #137 | Excellent $106,188 |
| Immigrants | Vietnam | 85.7 /100 | #138 | Excellent $106,186 |
| Luxembourgers | 85.7 /100 | #139 | Excellent $106,183 |
| Norwegians | 85.5 /100 | #140 | Excellent $106,144 |
| Immigrants | Syria | 85.3 /100 | #141 | Excellent $106,118 |
| Slovenes | 84.7 /100 | #142 | Excellent $106,020 |
| Tongans | 84.3 /100 | #143 | Excellent $105,967 |
| Immigrants | Morocco | 84.3 /100 | #144 | Excellent $105,964 |
| Danes | 83.8 /100 | #145 | Excellent $105,900 |
| Czechs | 83.4 /100 | #146 | Excellent $105,839 |
| Immigrants | Chile | 82.1 /100 | #147 | Excellent $105,655 |
| Hungarians | 81.7 /100 | #148 | Excellent $105,609 |
| Immigrants | Germany | 80.9 /100 | #149 | Excellent $105,507 |
| Irish | 80.5 /100 | #150 | Excellent $105,453 |
| Peruvians | 80.4 /100 | #151 | Excellent $105,444 |