Irish vs Immigrants from West Indies Single Father Households
COMPARE
Irish
Immigrants from West Indies
Single Father Households
Single Father Households Comparison
Irish
Immigrants from West Indies
2.3%
SINGLE FATHER HOUSEHOLDS
72.1/ 100
METRIC RATING
163rd/ 347
METRIC RANK
2.3%
SINGLE FATHER HOUSEHOLDS
77.9/ 100
METRIC RATING
159th/ 347
METRIC RANK
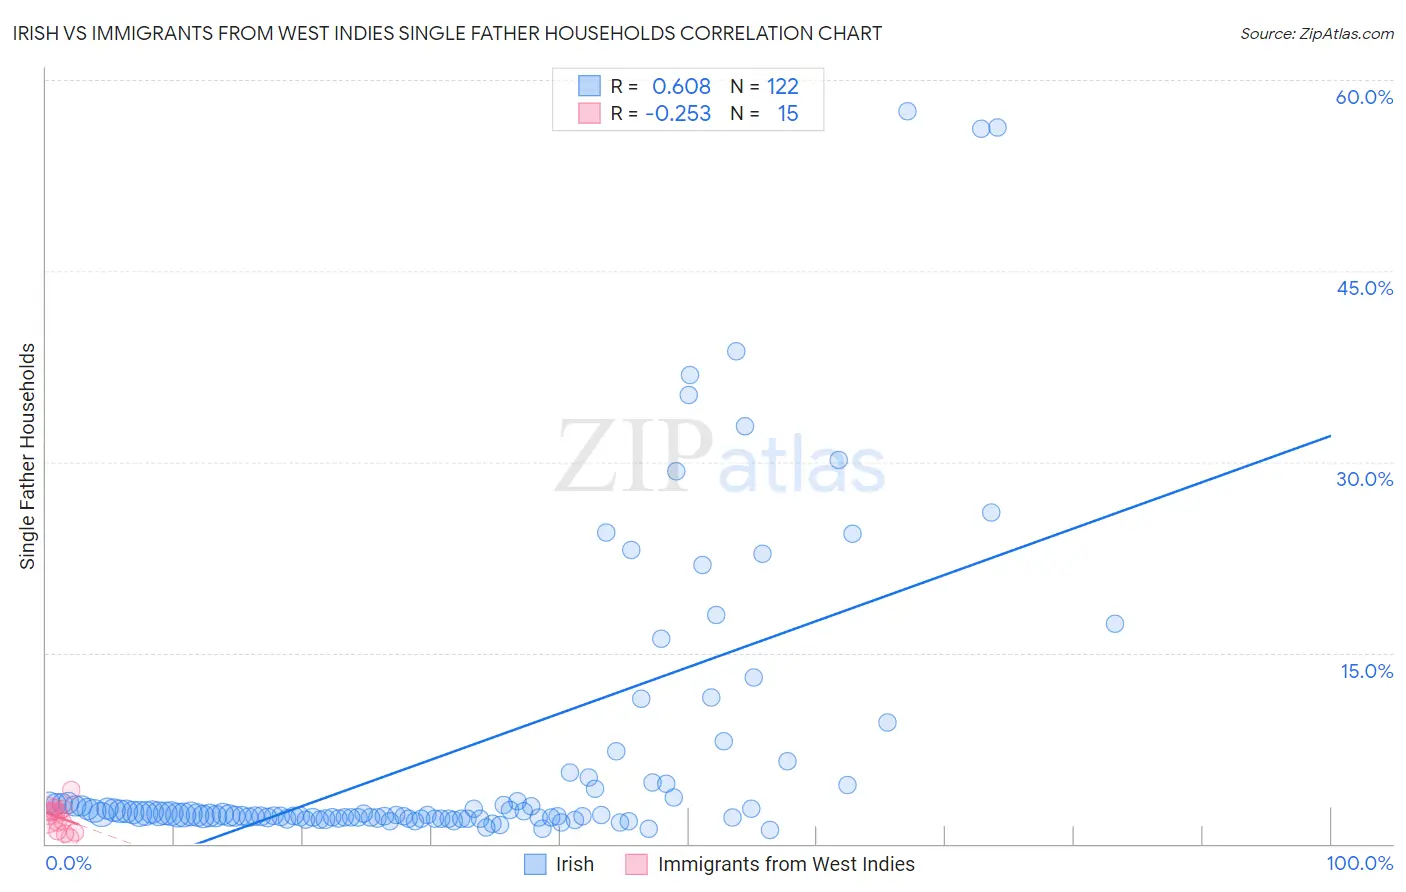
Irish vs Immigrants from West Indies Single Father Households Correlation Chart
The statistical analysis conducted on geographies consisting of 562,350,400 people shows a significant positive correlation between the proportion of Irish and percentage of single father households in the United States with a correlation coefficient (R) of 0.608 and weighted average of 2.3%. Similarly, the statistical analysis conducted on geographies consisting of 72,343,570 people shows a weak negative correlation between the proportion of Immigrants from West Indies and percentage of single father households in the United States with a correlation coefficient (R) of -0.253 and weighted average of 2.3%, a difference of 0.59%.
Single Father Households Correlation Summary
| Measurement | Irish | Immigrants from West Indies |
| Minimum | 1.1% | 0.47% |
| Maximum | 57.5% | 4.3% |
| Range | 56.4% | 3.8% |
| Mean | 7.1% | 2.1% |
| Median | 2.3% | 2.3% |
| Interquartile 25% (IQ1) | 2.1% | 0.99% |
| Interquartile 75% (IQ3) | 4.3% | 2.6% |
| Interquartile Range (IQR) | 2.3% | 1.6% |
| Standard Deviation (Sample) | 11.5% | 0.99% |
| Standard Deviation (Population) | 11.4% | 0.95% |
Demographics Similar to Irish and Immigrants from West Indies by Single Father Households
In terms of single father households, the demographic groups most similar to Irish are Scottish (2.3%, a difference of 0.070%), Swiss (2.3%, a difference of 0.11%), Pakistani (2.3%, a difference of 0.14%), Scotch-Irish (2.3%, a difference of 0.24%), and English (2.3%, a difference of 0.31%). Similarly, the demographic groups most similar to Immigrants from West Indies are Immigrants from Senegal (2.3%, a difference of 0.17%), Immigrants from Bolivia (2.3%, a difference of 0.18%), Canadian (2.3%, a difference of 0.20%), Immigrants from South America (2.3%, a difference of 0.22%), and European (2.3%, a difference of 0.34%).
| Demographics | Rating | Rank | Single Father Households |
| Immigrants | Syria | 84.8 /100 | #151 | Excellent 2.3% |
| Immigrants | Venezuela | 83.2 /100 | #152 | Excellent 2.3% |
| Immigrants | Germany | 82.8 /100 | #153 | Excellent 2.3% |
| Bolivians | 81.0 /100 | #154 | Excellent 2.3% |
| Europeans | 80.9 /100 | #155 | Excellent 2.3% |
| Immigrants | South America | 79.9 /100 | #156 | Good 2.3% |
| Canadians | 79.7 /100 | #157 | Good 2.3% |
| Immigrants | Senegal | 79.4 /100 | #158 | Good 2.3% |
| Immigrants | West Indies | 77.9 /100 | #159 | Good 2.3% |
| Immigrants | Bolivia | 76.3 /100 | #160 | Good 2.3% |
| Swiss | 73.2 /100 | #161 | Good 2.3% |
| Scottish | 72.8 /100 | #162 | Good 2.3% |
| Irish | 72.1 /100 | #163 | Good 2.3% |
| Pakistanis | 70.6 /100 | #164 | Good 2.3% |
| Scotch-Irish | 69.4 /100 | #165 | Good 2.3% |
| English | 68.6 /100 | #166 | Good 2.3% |
| South Americans | 64.3 /100 | #167 | Good 2.3% |
| Icelanders | 63.1 /100 | #168 | Good 2.3% |
| Czechs | 62.5 /100 | #169 | Good 2.3% |
| Ugandans | 62.2 /100 | #170 | Good 2.3% |
| Swedes | 61.6 /100 | #171 | Good 2.3% |