Irish vs Slovak Median Earnings
COMPARE
Irish
Slovak
Median Earnings
Median Earnings Comparison
Irish
Slovaks
$47,276
MEDIAN EARNINGS
76.6/ 100
METRIC RATING
156th/ 347
METRIC RANK
$47,095
MEDIAN EARNINGS
71.7/ 100
METRIC RATING
158th/ 347
METRIC RANK
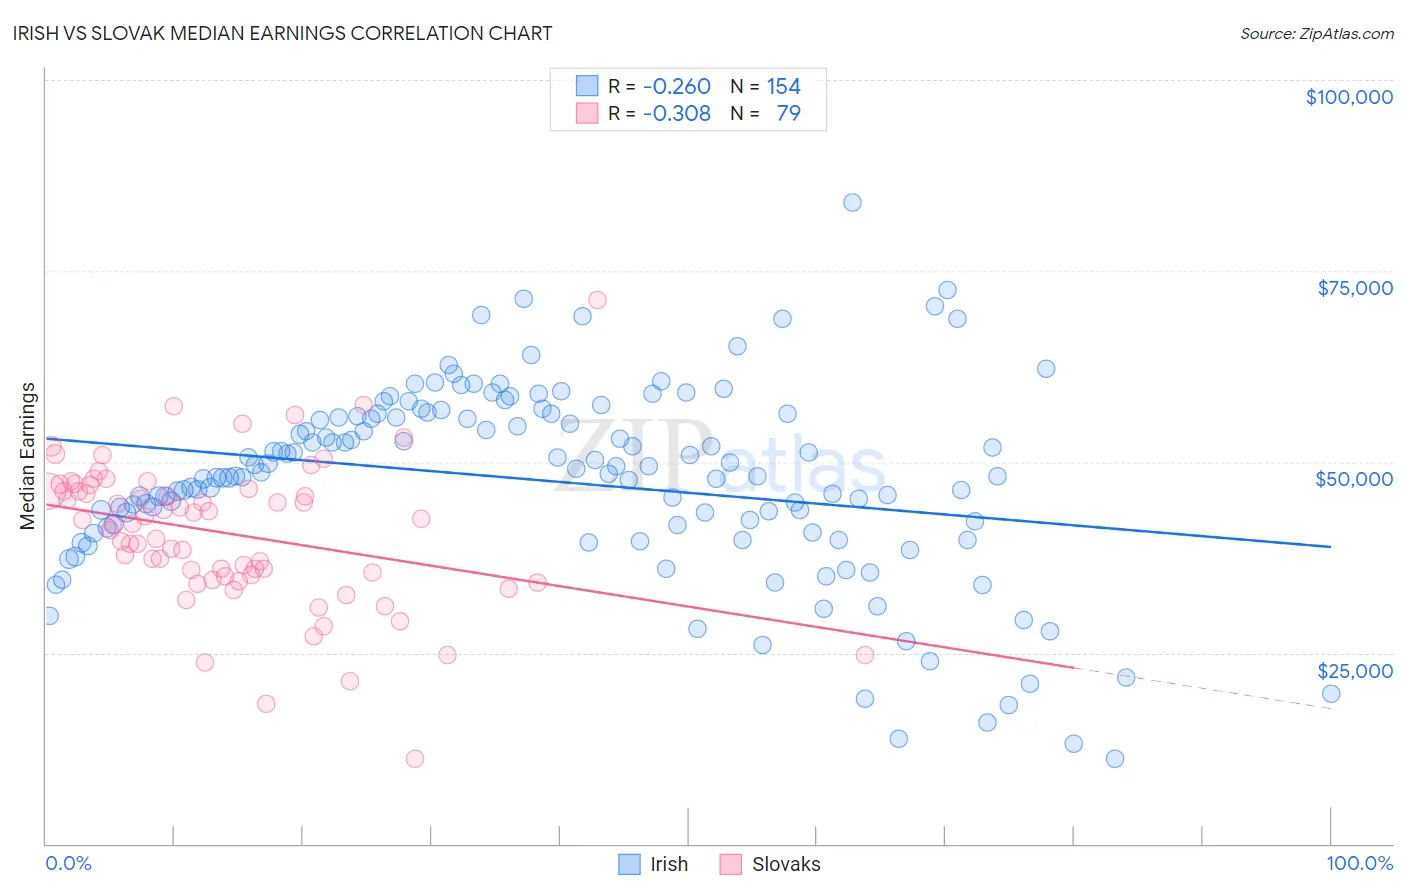
Irish vs Slovak Median Earnings Correlation Chart
The statistical analysis conducted on geographies consisting of 579,915,662 people shows a weak negative correlation between the proportion of Irish and median earnings in the United States with a correlation coefficient (R) of -0.260 and weighted average of $47,276. Similarly, the statistical analysis conducted on geographies consisting of 397,848,187 people shows a mild negative correlation between the proportion of Slovaks and median earnings in the United States with a correlation coefficient (R) of -0.308 and weighted average of $47,095, a difference of 0.38%.
Median Earnings Correlation Summary
| Measurement | Irish | Slovak |
| Minimum | $11,055 | $11,076 |
| Maximum | $83,906 | $71,150 |
| Range | $72,851 | $60,074 |
| Mean | $47,509 | $40,661 |
| Median | $48,301 | $41,901 |
| Interquartile 25% (IQ1) | $41,366 | $35,020 |
| Interquartile 75% (IQ3) | $56,002 | $46,429 |
| Interquartile Range (IQR) | $14,636 | $11,409 |
| Standard Deviation (Sample) | $12,668 | $9,606 |
| Standard Deviation (Population) | $12,626 | $9,545 |
Demographics Similar to Irish and Slovaks by Median Earnings
In terms of median earnings, the demographic groups most similar to Irish are Immigrants from Vietnam ($47,282, a difference of 0.010%), Immigrants from Portugal ($47,304, a difference of 0.060%), Czech ($47,221, a difference of 0.12%), Slavic ($47,470, a difference of 0.41%), and Immigrants from Peru ($47,025, a difference of 0.53%). Similarly, the demographic groups most similar to Slovaks are Immigrants from Peru ($47,025, a difference of 0.15%), Alsatian ($47,023, a difference of 0.15%), Czech ($47,221, a difference of 0.27%), Immigrants from Eastern Africa ($46,969, a difference of 0.27%), and South American Indian ($46,952, a difference of 0.31%).
| Demographics | Rating | Rank | Median Earnings |
| Immigrants | South Eastern Asia | 85.0 /100 | #147 | Excellent $47,671 |
| Immigrants | Eritrea | 84.8 /100 | #148 | Excellent $47,657 |
| Luxembourgers | 84.5 /100 | #149 | Excellent $47,640 |
| Peruvians | 84.2 /100 | #150 | Excellent $47,628 |
| Immigrants | Oceania | 84.1 /100 | #151 | Excellent $47,617 |
| Immigrants | Germany | 83.1 /100 | #152 | Excellent $47,566 |
| Slavs | 81.1 /100 | #153 | Excellent $47,470 |
| Immigrants | Portugal | 77.3 /100 | #154 | Good $47,304 |
| Immigrants | Vietnam | 76.7 /100 | #155 | Good $47,282 |
| Irish | 76.6 /100 | #156 | Good $47,276 |
| Czechs | 75.1 /100 | #157 | Good $47,221 |
| Slovaks | 71.7 /100 | #158 | Good $47,095 |
| Immigrants | Peru | 69.6 /100 | #159 | Good $47,025 |
| Alsatians | 69.6 /100 | #160 | Good $47,023 |
| Immigrants | Eastern Africa | 68.0 /100 | #161 | Good $46,969 |
| South American Indians | 67.4 /100 | #162 | Good $46,952 |
| Icelanders | 66.3 /100 | #163 | Good $46,916 |
| Norwegians | 64.7 /100 | #164 | Good $46,865 |
| South Americans | 62.7 /100 | #165 | Good $46,804 |
| Czechoslovakians | 57.8 /100 | #166 | Average $46,658 |
| Costa Ricans | 57.4 /100 | #167 | Average $46,645 |