Irish vs American Median Earnings
COMPARE
Irish
American
Median Earnings
Median Earnings Comparison
Irish
Americans
$47,276
MEDIAN EARNINGS
76.6/ 100
METRIC RATING
156th/ 347
METRIC RANK
$42,742
MEDIAN EARNINGS
0.6/ 100
METRIC RATING
268th/ 347
METRIC RANK
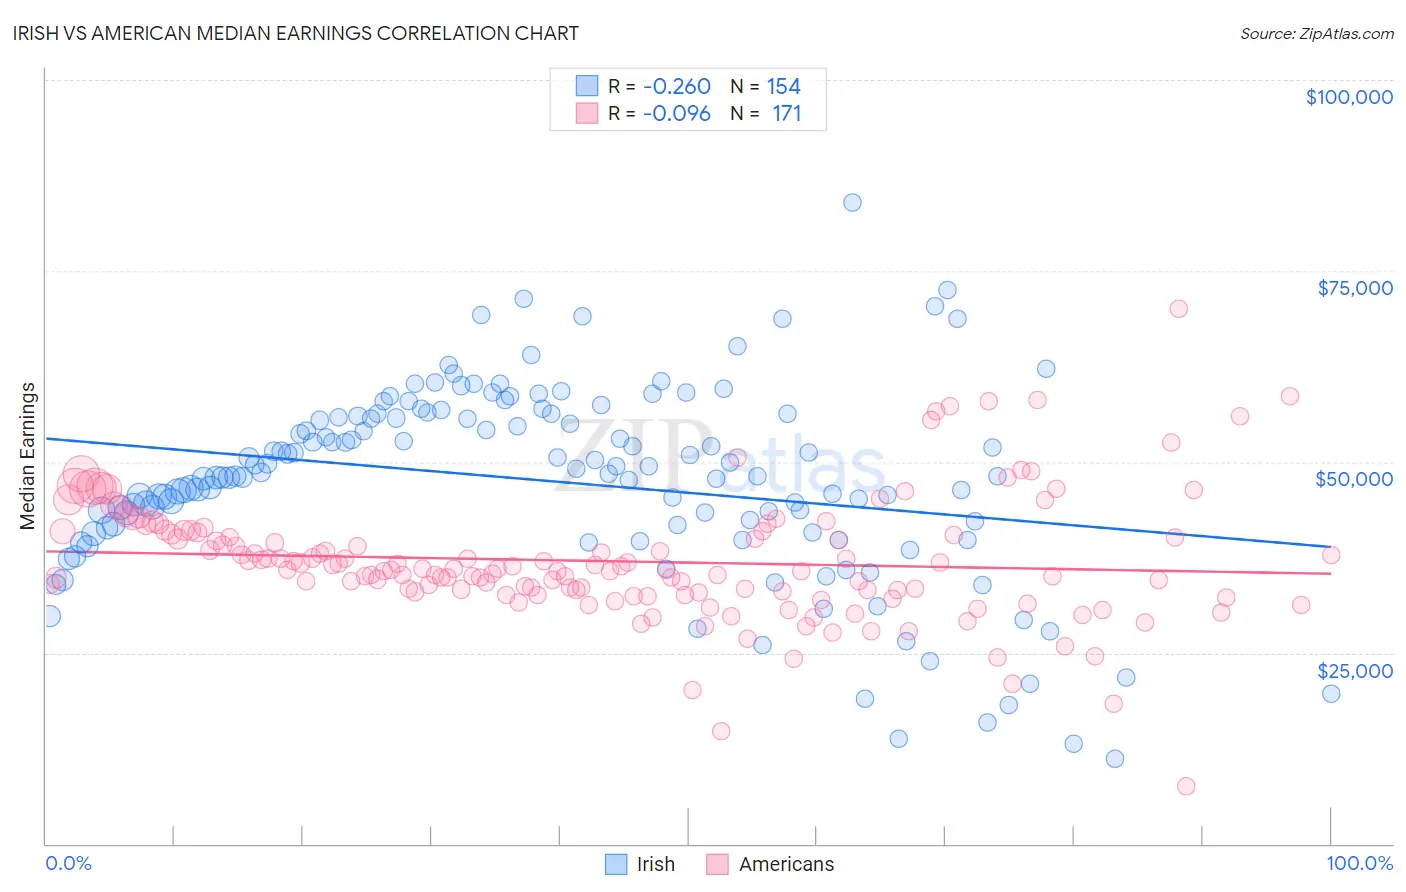
Irish vs American Median Earnings Correlation Chart
The statistical analysis conducted on geographies consisting of 579,915,662 people shows a weak negative correlation between the proportion of Irish and median earnings in the United States with a correlation coefficient (R) of -0.260 and weighted average of $47,276. Similarly, the statistical analysis conducted on geographies consisting of 581,345,964 people shows a slight negative correlation between the proportion of Americans and median earnings in the United States with a correlation coefficient (R) of -0.096 and weighted average of $42,742, a difference of 10.6%.
Median Earnings Correlation Summary
| Measurement | Irish | American |
| Minimum | $11,055 | $7,598 |
| Maximum | $83,906 | $70,000 |
| Range | $72,851 | $62,402 |
| Mean | $47,509 | $36,993 |
| Median | $48,301 | $35,919 |
| Interquartile 25% (IQ1) | $41,366 | $32,980 |
| Interquartile 75% (IQ3) | $56,002 | $40,815 |
| Interquartile Range (IQR) | $14,636 | $7,835 |
| Standard Deviation (Sample) | $12,668 | $8,064 |
| Standard Deviation (Population) | $12,626 | $8,040 |
Similar Demographics by Median Earnings
Demographics Similar to Irish by Median Earnings
In terms of median earnings, the demographic groups most similar to Irish are Immigrants from Vietnam ($47,282, a difference of 0.010%), Immigrants from Portugal ($47,304, a difference of 0.060%), Czech ($47,221, a difference of 0.12%), Slovak ($47,095, a difference of 0.38%), and Slavic ($47,470, a difference of 0.41%).
| Demographics | Rating | Rank | Median Earnings |
| Luxembourgers | 84.5 /100 | #149 | Excellent $47,640 |
| Peruvians | 84.2 /100 | #150 | Excellent $47,628 |
| Immigrants | Oceania | 84.1 /100 | #151 | Excellent $47,617 |
| Immigrants | Germany | 83.1 /100 | #152 | Excellent $47,566 |
| Slavs | 81.1 /100 | #153 | Excellent $47,470 |
| Immigrants | Portugal | 77.3 /100 | #154 | Good $47,304 |
| Immigrants | Vietnam | 76.7 /100 | #155 | Good $47,282 |
| Irish | 76.6 /100 | #156 | Good $47,276 |
| Czechs | 75.1 /100 | #157 | Good $47,221 |
| Slovaks | 71.7 /100 | #158 | Good $47,095 |
| Immigrants | Peru | 69.6 /100 | #159 | Good $47,025 |
| Alsatians | 69.6 /100 | #160 | Good $47,023 |
| Immigrants | Eastern Africa | 68.0 /100 | #161 | Good $46,969 |
| South American Indians | 67.4 /100 | #162 | Good $46,952 |
| Icelanders | 66.3 /100 | #163 | Good $46,916 |
Demographics Similar to Americans by Median Earnings
In terms of median earnings, the demographic groups most similar to Americans are Cree ($42,777, a difference of 0.080%), Belizean ($42,702, a difference of 0.090%), Osage ($42,651, a difference of 0.21%), Pennsylvania German ($42,615, a difference of 0.30%), and Immigrants from Laos ($42,884, a difference of 0.33%).
| Demographics | Rating | Rank | Median Earnings |
| Immigrants | Jamaica | 0.8 /100 | #261 | Tragic $43,026 |
| Nicaraguans | 0.8 /100 | #262 | Tragic $43,026 |
| Inupiat | 0.8 /100 | #263 | Tragic $43,000 |
| Immigrants | Liberia | 0.7 /100 | #264 | Tragic $42,923 |
| Salvadorans | 0.7 /100 | #265 | Tragic $42,912 |
| Immigrants | Laos | 0.7 /100 | #266 | Tragic $42,884 |
| Cree | 0.6 /100 | #267 | Tragic $42,777 |
| Americans | 0.6 /100 | #268 | Tragic $42,742 |
| Belizeans | 0.5 /100 | #269 | Tragic $42,702 |
| Osage | 0.5 /100 | #270 | Tragic $42,651 |
| Pennsylvania Germans | 0.5 /100 | #271 | Tragic $42,615 |
| Iroquois | 0.4 /100 | #272 | Tragic $42,430 |
| Immigrants | Dominica | 0.4 /100 | #273 | Tragic $42,420 |
| Immigrants | El Salvador | 0.4 /100 | #274 | Tragic $42,413 |
| Immigrants | Belize | 0.3 /100 | #275 | Tragic $42,339 |