Iraqi vs Immigrants from Chile Median Earnings
COMPARE
Iraqi
Immigrants from Chile
Median Earnings
Median Earnings Comparison
Iraqis
Immigrants from Chile
$46,140
MEDIAN EARNINGS
39.9/ 100
METRIC RATING
187th/ 347
METRIC RANK
$47,697
MEDIAN EARNINGS
85.5/ 100
METRIC RATING
146th/ 347
METRIC RANK
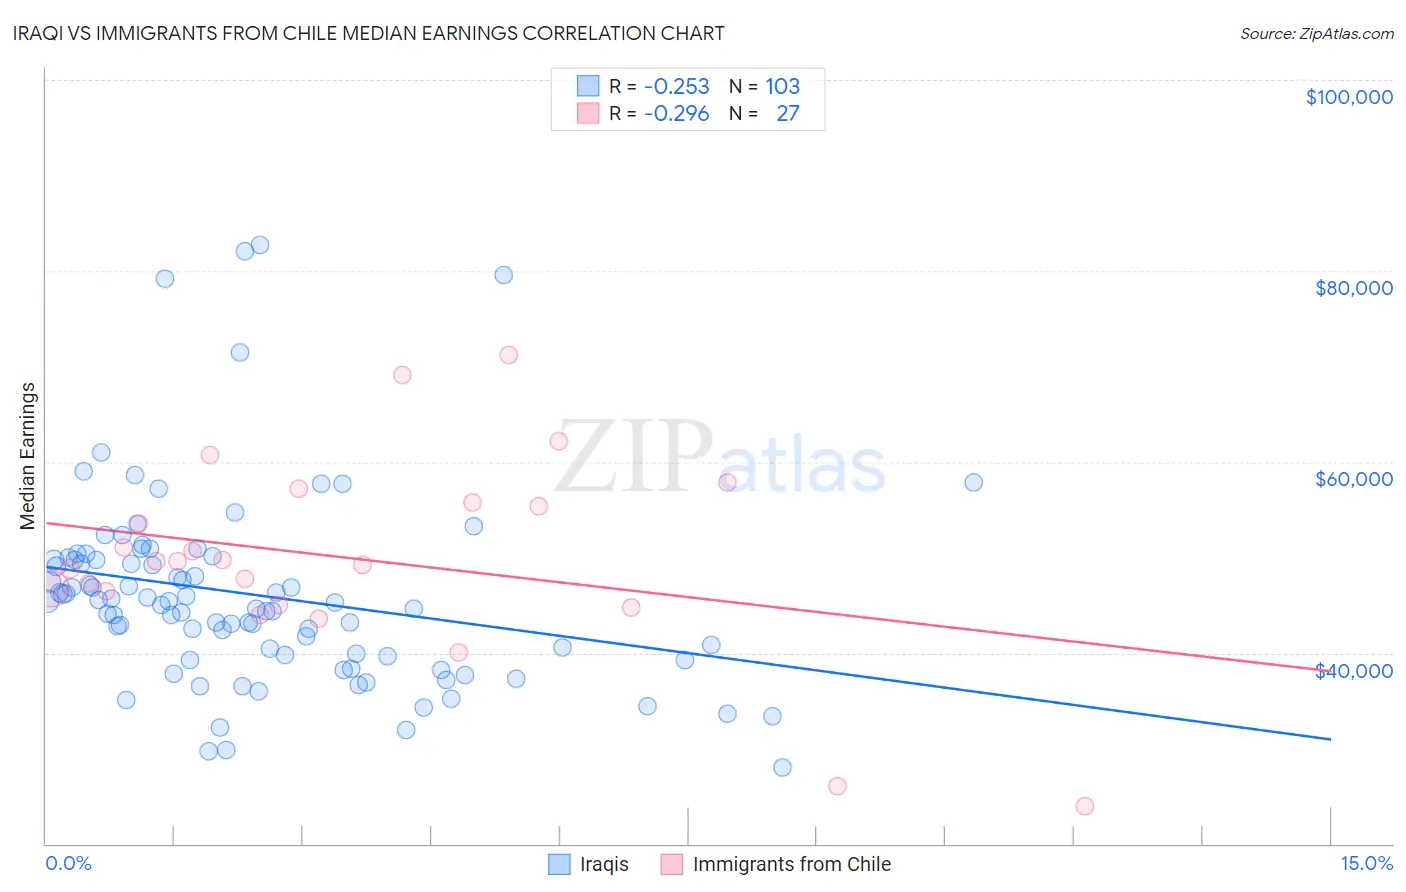
Iraqi vs Immigrants from Chile Median Earnings Correlation Chart
The statistical analysis conducted on geographies consisting of 170,634,576 people shows a weak negative correlation between the proportion of Iraqis and median earnings in the United States with a correlation coefficient (R) of -0.253 and weighted average of $46,140. Similarly, the statistical analysis conducted on geographies consisting of 218,645,469 people shows a weak negative correlation between the proportion of Immigrants from Chile and median earnings in the United States with a correlation coefficient (R) of -0.296 and weighted average of $47,697, a difference of 3.4%.
Median Earnings Correlation Summary
| Measurement | Iraqi | Immigrants from Chile |
| Minimum | $27,932 | $23,911 |
| Maximum | $82,727 | $71,250 |
| Range | $54,795 | $47,339 |
| Mean | $46,064 | $49,886 |
| Median | $45,313 | $49,642 |
| Interquartile 25% (IQ1) | $39,685 | $45,024 |
| Interquartile 75% (IQ3) | $49,745 | $55,791 |
| Interquartile Range (IQR) | $10,060 | $10,767 |
| Standard Deviation (Sample) | $10,188 | $10,356 |
| Standard Deviation (Population) | $10,138 | $10,162 |
Similar Demographics by Median Earnings
Demographics Similar to Iraqis by Median Earnings
In terms of median earnings, the demographic groups most similar to Iraqis are Vietnamese ($46,172, a difference of 0.070%), Immigrants from Armenia ($46,094, a difference of 0.10%), Uruguayan ($46,190, a difference of 0.11%), Immigrants from Kenya ($46,214, a difference of 0.16%), and Spaniard ($46,059, a difference of 0.18%).
| Demographics | Rating | Rank | Median Earnings |
| Puget Sound Salish | 46.5 /100 | #180 | Average $46,333 |
| Immigrants | Cameroon | 46.4 /100 | #181 | Average $46,329 |
| Swiss | 45.9 /100 | #182 | Average $46,315 |
| French | 45.2 /100 | #183 | Average $46,296 |
| Immigrants | Kenya | 42.4 /100 | #184 | Average $46,214 |
| Uruguayans | 41.6 /100 | #185 | Average $46,190 |
| Vietnamese | 40.9 /100 | #186 | Average $46,172 |
| Iraqis | 39.9 /100 | #187 | Fair $46,140 |
| Immigrants | Armenia | 38.3 /100 | #188 | Fair $46,094 |
| Spaniards | 37.2 /100 | #189 | Fair $46,059 |
| French Canadians | 36.1 /100 | #190 | Fair $46,026 |
| Finns | 33.4 /100 | #191 | Fair $45,940 |
| Germans | 33.2 /100 | #192 | Fair $45,935 |
| Guamanians/Chamorros | 33.2 /100 | #193 | Fair $45,933 |
| Immigrants | Costa Rica | 33.0 /100 | #194 | Fair $45,928 |
Demographics Similar to Immigrants from Chile by Median Earnings
In terms of median earnings, the demographic groups most similar to Immigrants from Chile are Immigrants from Saudi Arabia ($47,704, a difference of 0.010%), Immigrants from South Eastern Asia ($47,671, a difference of 0.060%), Immigrants from Eritrea ($47,657, a difference of 0.080%), Luxembourger ($47,640, a difference of 0.12%), and Peruvian ($47,628, a difference of 0.15%).
| Demographics | Rating | Rank | Median Earnings |
| Canadians | 88.8 /100 | #139 | Excellent $47,911 |
| Taiwanese | 88.7 /100 | #140 | Excellent $47,902 |
| Immigrants | Sierra Leone | 88.3 /100 | #141 | Excellent $47,875 |
| Ugandans | 88.0 /100 | #142 | Excellent $47,854 |
| Swedes | 88.0 /100 | #143 | Excellent $47,851 |
| Hungarians | 87.1 /100 | #144 | Excellent $47,795 |
| Immigrants | Saudi Arabia | 85.6 /100 | #145 | Excellent $47,704 |
| Immigrants | Chile | 85.5 /100 | #146 | Excellent $47,697 |
| Immigrants | South Eastern Asia | 85.0 /100 | #147 | Excellent $47,671 |
| Immigrants | Eritrea | 84.8 /100 | #148 | Excellent $47,657 |
| Luxembourgers | 84.5 /100 | #149 | Excellent $47,640 |
| Peruvians | 84.2 /100 | #150 | Excellent $47,628 |
| Immigrants | Oceania | 84.1 /100 | #151 | Excellent $47,617 |
| Immigrants | Germany | 83.1 /100 | #152 | Excellent $47,566 |
| Slavs | 81.1 /100 | #153 | Excellent $47,470 |