Immigrants from Denmark vs Belgian Median Family Income
COMPARE
Immigrants from Denmark
Belgian
Median Family Income
Median Family Income Comparison
Immigrants from Denmark
Belgians
$120,445
MEDIAN FAMILY INCOME
100.0/ 100
METRIC RATING
28th/ 347
METRIC RANK
$102,788
MEDIAN FAMILY INCOME
51.4/ 100
METRIC RATING
173rd/ 347
METRIC RANK
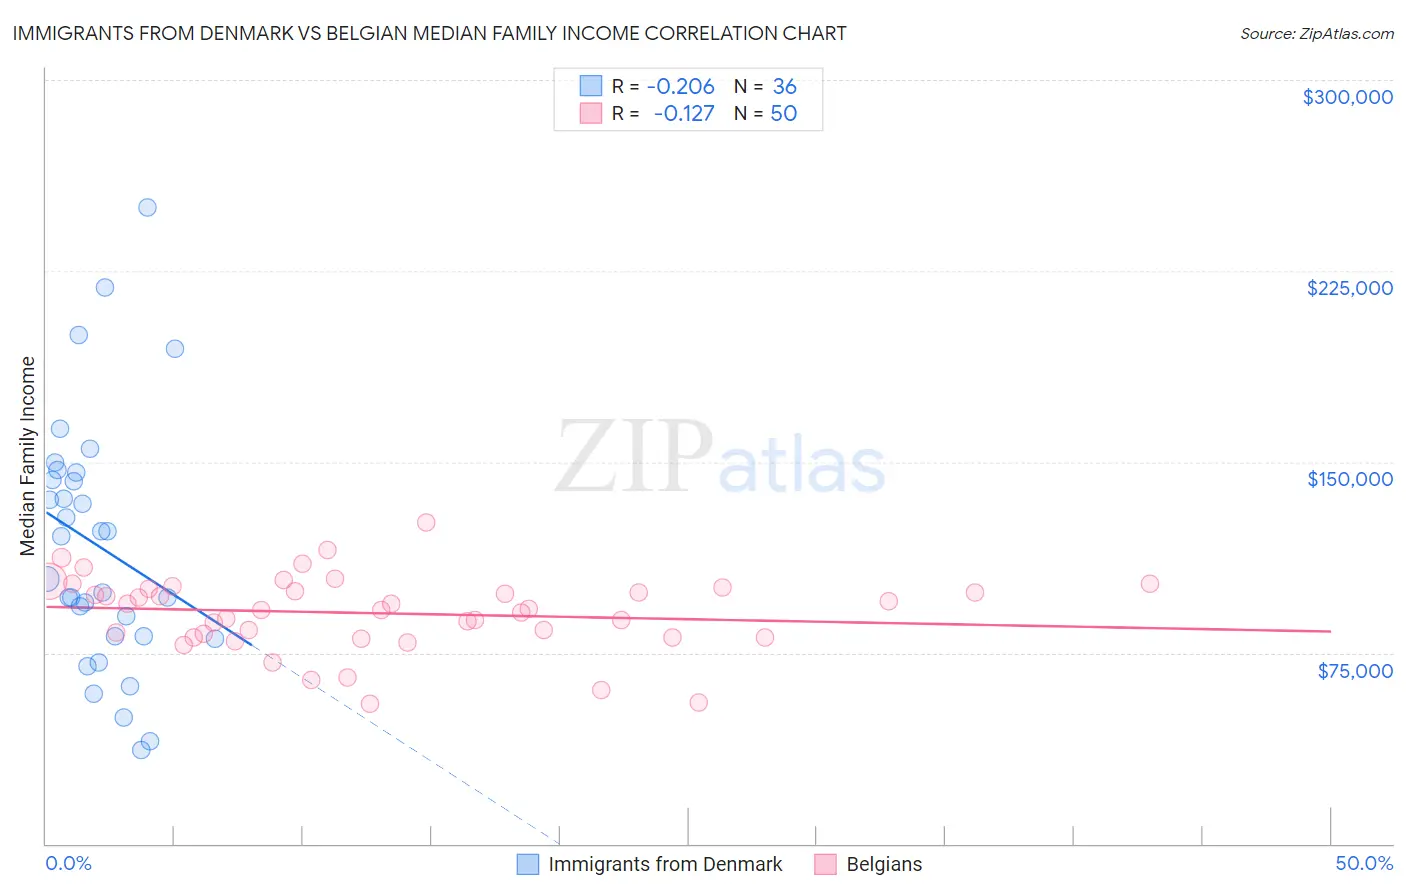
Immigrants from Denmark vs Belgian Median Family Income Correlation Chart
The statistical analysis conducted on geographies consisting of 136,397,640 people shows a weak negative correlation between the proportion of Immigrants from Denmark and median family income in the United States with a correlation coefficient (R) of -0.206 and weighted average of $120,445. Similarly, the statistical analysis conducted on geographies consisting of 355,758,296 people shows a poor negative correlation between the proportion of Belgians and median family income in the United States with a correlation coefficient (R) of -0.127 and weighted average of $102,788, a difference of 17.2%.
Median Family Income Correlation Summary
| Measurement | Immigrants from Denmark | Belgian |
| Minimum | $36,611 | $55,000 |
| Maximum | $250,001 | $126,094 |
| Range | $213,390 | $71,094 |
| Mean | $116,902 | $90,563 |
| Median | $112,401 | $92,069 |
| Interquartile 25% (IQ1) | $81,504 | $81,250 |
| Interquartile 75% (IQ3) | $144,309 | $100,134 |
| Interquartile Range (IQR) | $62,805 | $18,884 |
| Standard Deviation (Sample) | $49,223 | $14,839 |
| Standard Deviation (Population) | $48,535 | $14,690 |
Similar Demographics by Median Family Income
Demographics Similar to Immigrants from Denmark by Median Family Income
In terms of median family income, the demographic groups most similar to Immigrants from Denmark are Russian ($120,487, a difference of 0.040%), Latvian ($120,301, a difference of 0.12%), Immigrants from Sri Lanka ($120,263, a difference of 0.15%), Immigrants from Switzerland ($120,726, a difference of 0.23%), and Immigrants from France ($120,076, a difference of 0.31%).
| Demographics | Rating | Rank | Median Family Income |
| Immigrants | Korea | 100.0 /100 | #21 | Exceptional $122,800 |
| Immigrants | Sweden | 100.0 /100 | #22 | Exceptional $122,765 |
| Immigrants | Japan | 100.0 /100 | #23 | Exceptional $122,764 |
| Immigrants | Northern Europe | 100.0 /100 | #24 | Exceptional $121,840 |
| Turks | 100.0 /100 | #25 | Exceptional $121,202 |
| Immigrants | Switzerland | 100.0 /100 | #26 | Exceptional $120,726 |
| Russians | 100.0 /100 | #27 | Exceptional $120,487 |
| Immigrants | Denmark | 100.0 /100 | #28 | Exceptional $120,445 |
| Latvians | 100.0 /100 | #29 | Exceptional $120,301 |
| Immigrants | Sri Lanka | 100.0 /100 | #30 | Exceptional $120,263 |
| Immigrants | France | 100.0 /100 | #31 | Exceptional $120,076 |
| Asians | 100.0 /100 | #32 | Exceptional $119,955 |
| Bhutanese | 100.0 /100 | #33 | Exceptional $119,800 |
| Bolivians | 100.0 /100 | #34 | Exceptional $119,479 |
| Soviet Union | 100.0 /100 | #35 | Exceptional $119,262 |
Demographics Similar to Belgians by Median Family Income
In terms of median family income, the demographic groups most similar to Belgians are Immigrants from Eritrea ($102,823, a difference of 0.030%), Finnish ($102,676, a difference of 0.11%), Alsatian ($103,010, a difference of 0.22%), Immigrants from Eastern Africa ($102,451, a difference of 0.33%), and Immigrants from Uzbekistan ($103,197, a difference of 0.40%).
| Demographics | Rating | Rank | Median Family Income |
| English | 62.6 /100 | #166 | Good $103,684 |
| South American Indians | 61.9 /100 | #167 | Good $103,624 |
| Immigrants | Peru | 60.8 /100 | #168 | Good $103,534 |
| Czechoslovakians | 57.6 /100 | #169 | Average $103,273 |
| Immigrants | Uzbekistan | 56.6 /100 | #170 | Average $103,197 |
| Alsatians | 54.3 /100 | #171 | Average $103,010 |
| Immigrants | Eritrea | 51.9 /100 | #172 | Average $102,823 |
| Belgians | 51.4 /100 | #173 | Average $102,788 |
| Finns | 50.0 /100 | #174 | Average $102,676 |
| Immigrants | Eastern Africa | 47.1 /100 | #175 | Average $102,451 |
| French | 46.1 /100 | #176 | Average $102,368 |
| Germans | 44.6 /100 | #177 | Average $102,254 |
| Welsh | 43.3 /100 | #178 | Average $102,151 |
| South Americans | 39.7 /100 | #179 | Fair $101,856 |
| French Canadians | 37.0 /100 | #180 | Fair $101,634 |