Aleut vs Belgian Median Family Income
COMPARE
Aleut
Belgian
Median Family Income
Median Family Income Comparison
Aleuts
Belgians
$98,702
MEDIAN FAMILY INCOME
11.6/ 100
METRIC RATING
207th/ 347
METRIC RANK
$102,788
MEDIAN FAMILY INCOME
51.4/ 100
METRIC RATING
173rd/ 347
METRIC RANK
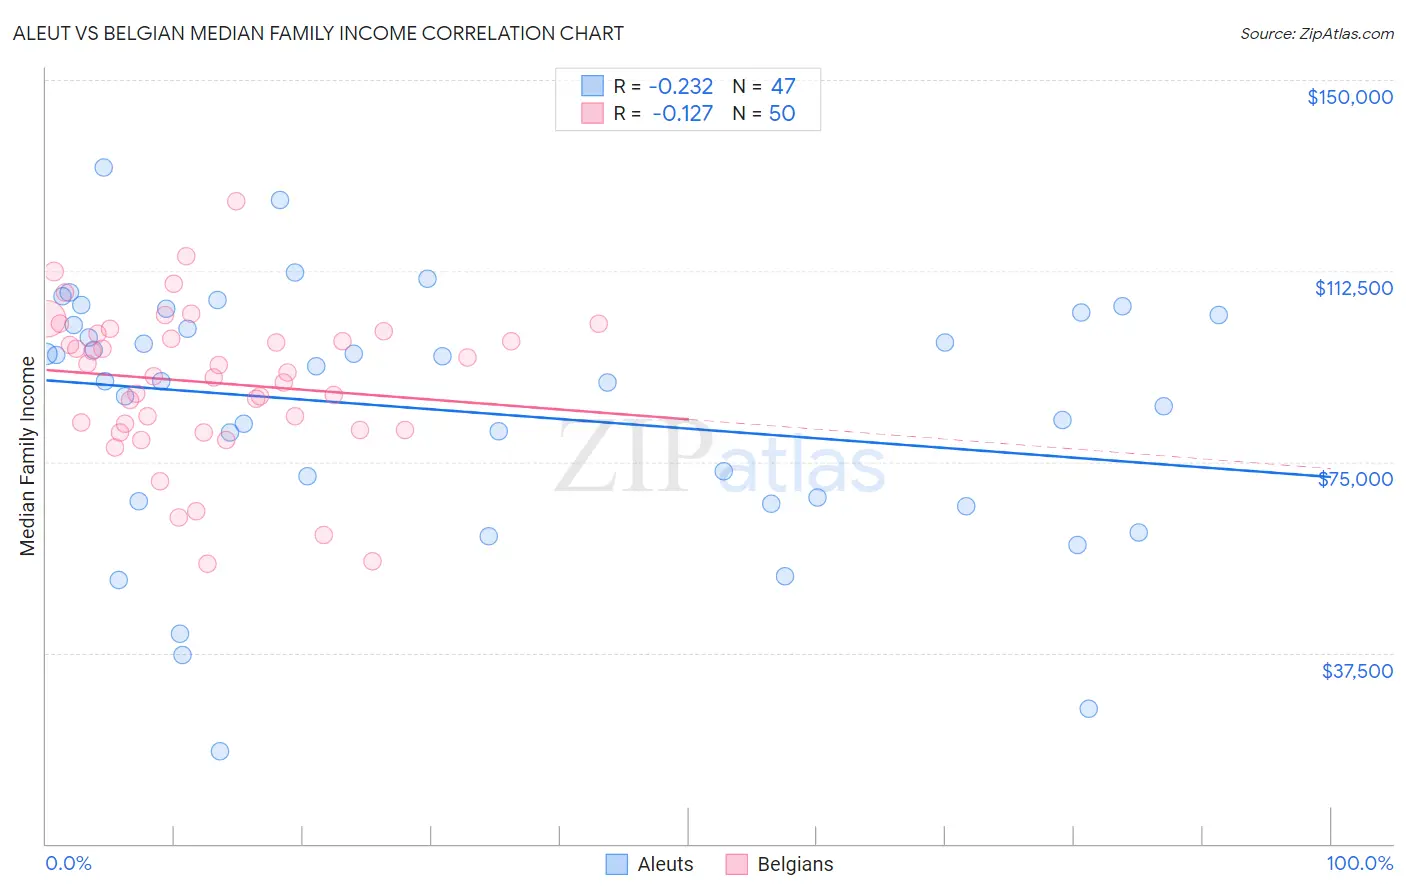
Aleut vs Belgian Median Family Income Correlation Chart
The statistical analysis conducted on geographies consisting of 61,771,380 people shows a weak negative correlation between the proportion of Aleuts and median family income in the United States with a correlation coefficient (R) of -0.232 and weighted average of $98,702. Similarly, the statistical analysis conducted on geographies consisting of 355,758,296 people shows a poor negative correlation between the proportion of Belgians and median family income in the United States with a correlation coefficient (R) of -0.127 and weighted average of $102,788, a difference of 4.1%.
Median Family Income Correlation Summary
| Measurement | Aleut | Belgian |
| Minimum | $18,125 | $55,000 |
| Maximum | $132,750 | $126,094 |
| Range | $114,625 | $71,094 |
| Mean | $85,071 | $90,563 |
| Median | $90,875 | $92,069 |
| Interquartile 25% (IQ1) | $67,198 | $81,250 |
| Interquartile 75% (IQ3) | $103,750 | $100,134 |
| Interquartile Range (IQR) | $36,552 | $18,884 |
| Standard Deviation (Sample) | $24,932 | $14,839 |
| Standard Deviation (Population) | $24,665 | $14,690 |
Similar Demographics by Median Family Income
Demographics Similar to Aleuts by Median Family Income
In terms of median family income, the demographic groups most similar to Aleuts are Immigrants from Iraq ($98,786, a difference of 0.080%), Hawaiian ($98,869, a difference of 0.17%), Ghanaian ($98,877, a difference of 0.18%), Immigrants from Uruguay ($98,205, a difference of 0.51%), and Immigrants from Colombia ($98,067, a difference of 0.65%).
| Demographics | Rating | Rank | Median Family Income |
| Spanish | 20.1 /100 | #200 | Fair $99,977 |
| Immigrants | Thailand | 19.0 /100 | #201 | Poor $99,840 |
| Whites/Caucasians | 18.7 /100 | #202 | Poor $99,800 |
| Scotch-Irish | 17.1 /100 | #203 | Poor $99,591 |
| Ghanaians | 12.6 /100 | #204 | Poor $98,877 |
| Hawaiians | 12.5 /100 | #205 | Poor $98,869 |
| Immigrants | Iraq | 12.1 /100 | #206 | Poor $98,786 |
| Aleuts | 11.6 /100 | #207 | Poor $98,702 |
| Immigrants | Uruguay | 9.2 /100 | #208 | Tragic $98,205 |
| Immigrants | Colombia | 8.7 /100 | #209 | Tragic $98,067 |
| Puget Sound Salish | 8.2 /100 | #210 | Tragic $97,958 |
| Immigrants | Sudan | 7.4 /100 | #211 | Tragic $97,737 |
| Panamanians | 7.2 /100 | #212 | Tragic $97,683 |
| Immigrants | Armenia | 7.0 /100 | #213 | Tragic $97,605 |
| Bermudans | 6.9 /100 | #214 | Tragic $97,577 |
Demographics Similar to Belgians by Median Family Income
In terms of median family income, the demographic groups most similar to Belgians are Immigrants from Eritrea ($102,823, a difference of 0.030%), Finnish ($102,676, a difference of 0.11%), Alsatian ($103,010, a difference of 0.22%), Immigrants from Eastern Africa ($102,451, a difference of 0.33%), and Immigrants from Uzbekistan ($103,197, a difference of 0.40%).
| Demographics | Rating | Rank | Median Family Income |
| English | 62.6 /100 | #166 | Good $103,684 |
| South American Indians | 61.9 /100 | #167 | Good $103,624 |
| Immigrants | Peru | 60.8 /100 | #168 | Good $103,534 |
| Czechoslovakians | 57.6 /100 | #169 | Average $103,273 |
| Immigrants | Uzbekistan | 56.6 /100 | #170 | Average $103,197 |
| Alsatians | 54.3 /100 | #171 | Average $103,010 |
| Immigrants | Eritrea | 51.9 /100 | #172 | Average $102,823 |
| Belgians | 51.4 /100 | #173 | Average $102,788 |
| Finns | 50.0 /100 | #174 | Average $102,676 |
| Immigrants | Eastern Africa | 47.1 /100 | #175 | Average $102,451 |
| French | 46.1 /100 | #176 | Average $102,368 |
| Germans | 44.6 /100 | #177 | Average $102,254 |
| Welsh | 43.3 /100 | #178 | Average $102,151 |
| South Americans | 39.7 /100 | #179 | Fair $101,856 |
| French Canadians | 37.0 /100 | #180 | Fair $101,634 |