Guatemalan vs Immigrants from Scotland Median Female Earnings
COMPARE
Guatemalan
Immigrants from Scotland
Median Female Earnings
Median Female Earnings Comparison
Guatemalans
Immigrants from Scotland
$35,695
MEDIAN FEMALE EARNINGS
0.0/ 100
METRIC RATING
293rd/ 347
METRIC RANK
$41,771
MEDIAN FEMALE EARNINGS
98.7/ 100
METRIC RATING
98th/ 347
METRIC RANK
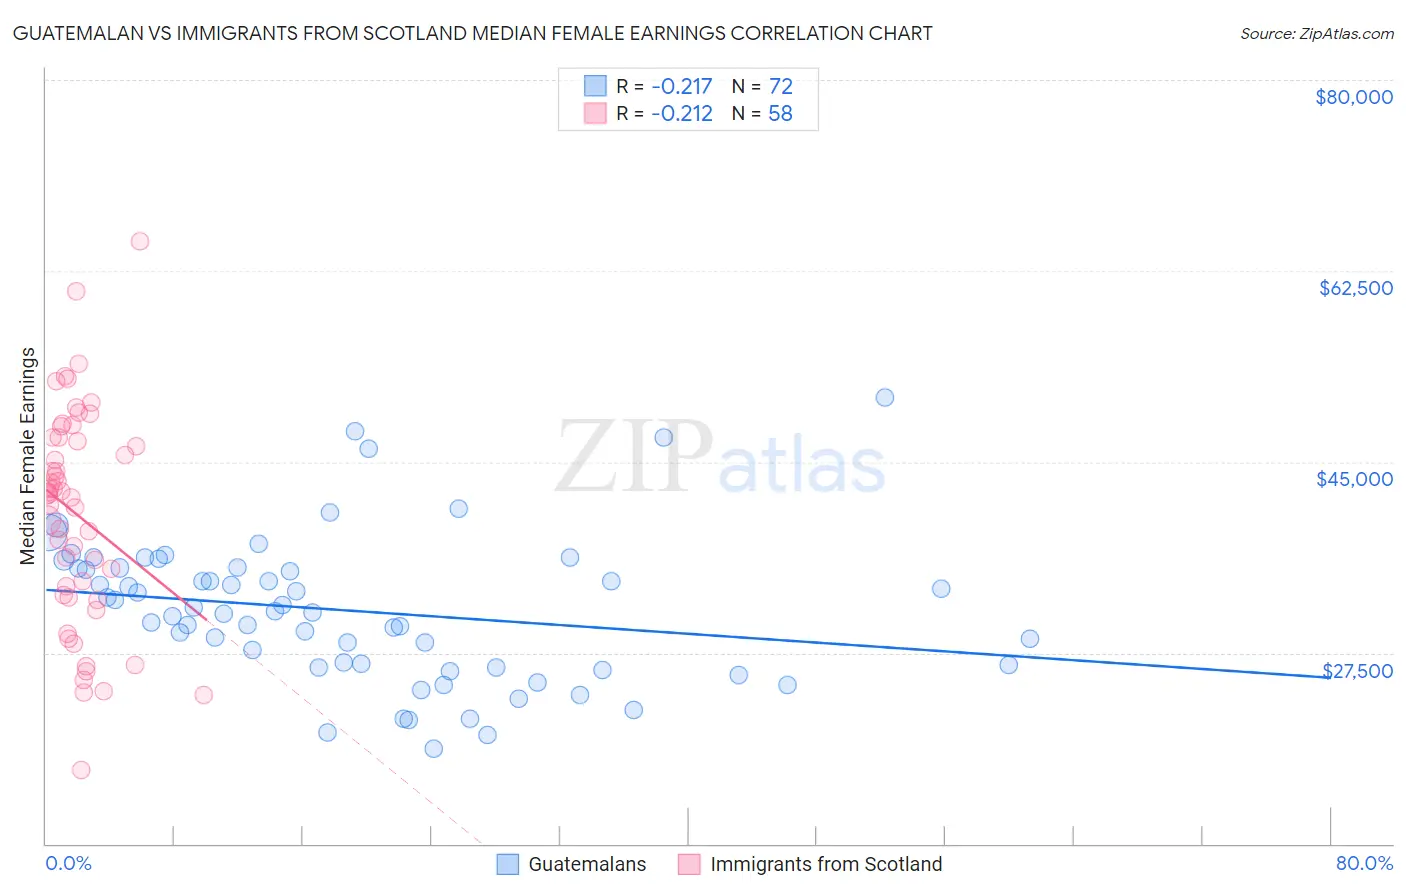
Guatemalan vs Immigrants from Scotland Median Female Earnings Correlation Chart
The statistical analysis conducted on geographies consisting of 409,414,975 people shows a weak negative correlation between the proportion of Guatemalans and median female earnings in the United States with a correlation coefficient (R) of -0.217 and weighted average of $35,695. Similarly, the statistical analysis conducted on geographies consisting of 196,348,950 people shows a weak negative correlation between the proportion of Immigrants from Scotland and median female earnings in the United States with a correlation coefficient (R) of -0.212 and weighted average of $41,771, a difference of 17.0%.
Median Female Earnings Correlation Summary
| Measurement | Guatemalan | Immigrants from Scotland |
| Minimum | $18,750 | $16,733 |
| Maximum | $50,917 | $65,203 |
| Range | $32,167 | $48,470 |
| Mean | $31,367 | $40,188 |
| Median | $31,263 | $42,027 |
| Interquartile 25% (IQ1) | $26,284 | $32,757 |
| Interquartile 75% (IQ3) | $35,245 | $47,181 |
| Interquartile Range (IQR) | $8,961 | $14,424 |
| Standard Deviation (Sample) | $6,641 | $9,888 |
| Standard Deviation (Population) | $6,594 | $9,803 |
Similar Demographics by Median Female Earnings
Demographics Similar to Guatemalans by Median Female Earnings
In terms of median female earnings, the demographic groups most similar to Guatemalans are Cheyenne ($35,673, a difference of 0.060%), Comanche ($35,661, a difference of 0.090%), Mexican American Indian ($35,629, a difference of 0.19%), American ($35,777, a difference of 0.23%), and Blackfeet ($35,864, a difference of 0.47%).
| Demographics | Rating | Rank | Median Female Earnings |
| Osage | 0.0 /100 | #286 | Tragic $36,034 |
| Immigrants | Nicaragua | 0.0 /100 | #287 | Tragic $36,023 |
| Immigrants | Zaire | 0.0 /100 | #288 | Tragic $36,017 |
| Bangladeshis | 0.0 /100 | #289 | Tragic $35,960 |
| Central American Indians | 0.0 /100 | #290 | Tragic $35,930 |
| Blackfeet | 0.0 /100 | #291 | Tragic $35,864 |
| Americans | 0.0 /100 | #292 | Tragic $35,777 |
| Guatemalans | 0.0 /100 | #293 | Tragic $35,695 |
| Cheyenne | 0.0 /100 | #294 | Tragic $35,673 |
| Comanche | 0.0 /100 | #295 | Tragic $35,661 |
| Mexican American Indians | 0.0 /100 | #296 | Tragic $35,629 |
| Hmong | 0.0 /100 | #297 | Tragic $35,498 |
| Immigrants | Micronesia | 0.0 /100 | #298 | Tragic $35,477 |
| Immigrants | Guatemala | 0.0 /100 | #299 | Tragic $35,444 |
| Yuman | 0.0 /100 | #300 | Tragic $35,377 |
Demographics Similar to Immigrants from Scotland by Median Female Earnings
In terms of median female earnings, the demographic groups most similar to Immigrants from Scotland are Immigrants from Hungary ($41,820, a difference of 0.12%), South African ($41,825, a difference of 0.13%), Immigrants from Barbados ($41,685, a difference of 0.21%), Moroccan ($41,872, a difference of 0.24%), and Immigrants from Netherlands ($41,870, a difference of 0.24%).
| Demographics | Rating | Rank | Median Female Earnings |
| Immigrants | Western Europe | 99.2 /100 | #91 | Exceptional $41,990 |
| Argentineans | 99.1 /100 | #92 | Exceptional $41,952 |
| Immigrants | Grenada | 99.0 /100 | #93 | Exceptional $41,932 |
| Moroccans | 98.9 /100 | #94 | Exceptional $41,872 |
| Immigrants | Netherlands | 98.9 /100 | #95 | Exceptional $41,870 |
| South Africans | 98.8 /100 | #96 | Exceptional $41,825 |
| Immigrants | Hungary | 98.8 /100 | #97 | Exceptional $41,820 |
| Immigrants | Scotland | 98.7 /100 | #98 | Exceptional $41,771 |
| Immigrants | Barbados | 98.4 /100 | #99 | Exceptional $41,685 |
| Romanians | 98.3 /100 | #100 | Exceptional $41,663 |
| Immigrants | Fiji | 98.3 /100 | #101 | Exceptional $41,656 |
| Immigrants | Poland | 98.2 /100 | #102 | Exceptional $41,630 |
| Immigrants | Argentina | 97.9 /100 | #103 | Exceptional $41,554 |
| Immigrants | Zimbabwe | 97.8 /100 | #104 | Exceptional $41,527 |
| Italians | 97.7 /100 | #105 | Exceptional $41,505 |