Iranian vs Immigrants from Lithuania Unemployment
COMPARE
Iranian
Immigrants from Lithuania
Unemployment
Unemployment Comparison
Iranians
Immigrants from Lithuania
5.1%
UNEMPLOYMENT
86.9/ 100
METRIC RATING
130th/ 347
METRIC RANK
5.0%
UNEMPLOYMENT
93.2/ 100
METRIC RATING
110th/ 347
METRIC RANK
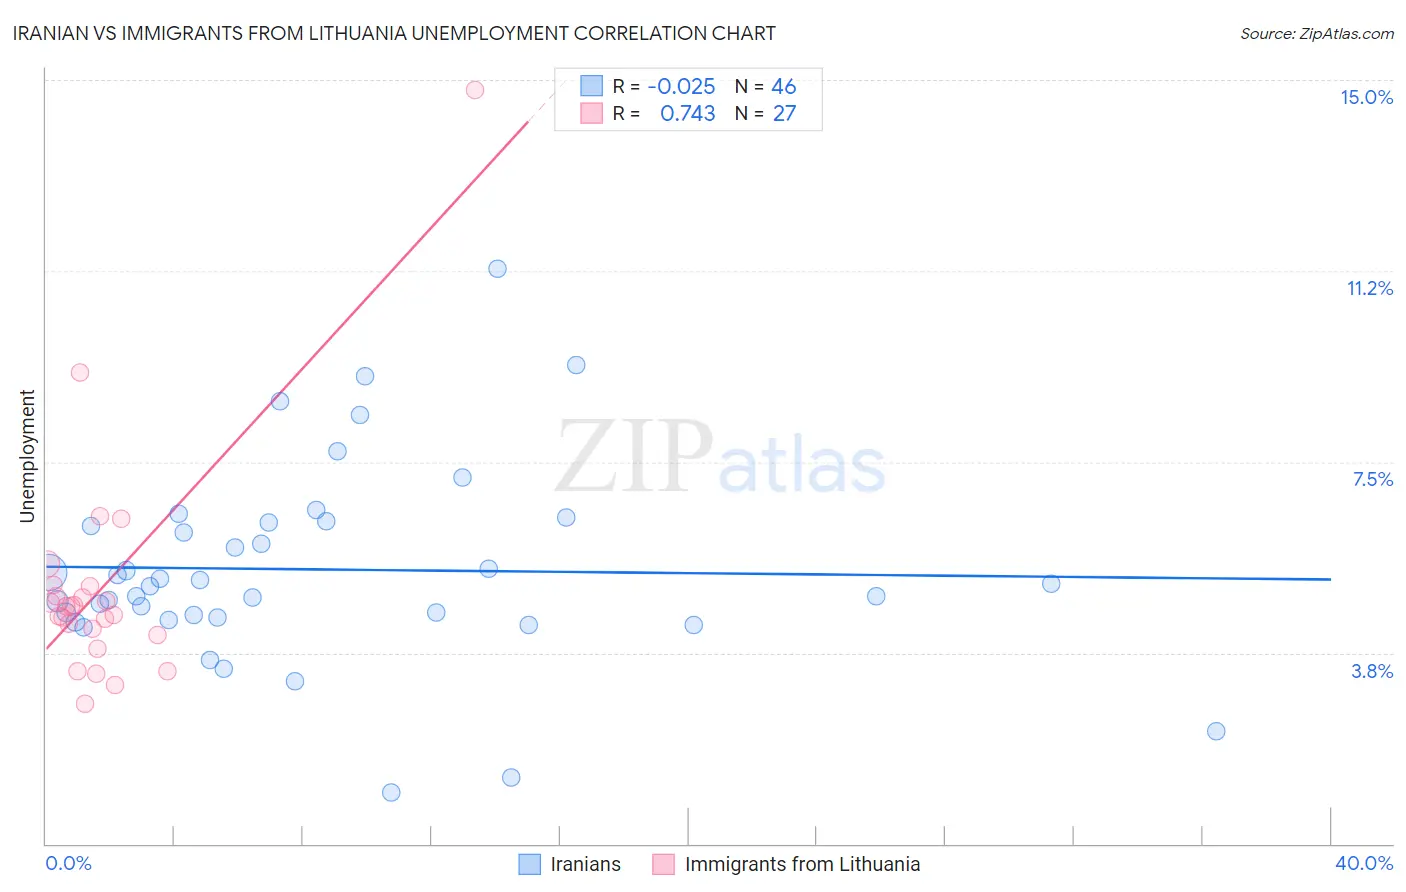
Iranian vs Immigrants from Lithuania Unemployment Correlation Chart
The statistical analysis conducted on geographies consisting of 316,755,420 people shows no correlation between the proportion of Iranians and unemployment in the United States with a correlation coefficient (R) of -0.025 and weighted average of 5.1%. Similarly, the statistical analysis conducted on geographies consisting of 117,711,175 people shows a strong positive correlation between the proportion of Immigrants from Lithuania and unemployment in the United States with a correlation coefficient (R) of 0.743 and weighted average of 5.0%, a difference of 1.2%.
Unemployment Correlation Summary
| Measurement | Iranian | Immigrants from Lithuania |
| Minimum | 1.0% | 2.7% |
| Maximum | 11.3% | 14.8% |
| Range | 10.3% | 12.1% |
| Mean | 5.4% | 5.0% |
| Median | 5.1% | 4.7% |
| Interquartile 25% (IQ1) | 4.4% | 4.1% |
| Interquartile 75% (IQ3) | 6.3% | 5.1% |
| Interquartile Range (IQR) | 1.9% | 0.96% |
| Standard Deviation (Sample) | 1.9% | 2.3% |
| Standard Deviation (Population) | 1.9% | 2.3% |
Demographics Similar to Iranians and Immigrants from Lithuania by Unemployment
In terms of unemployment, the demographic groups most similar to Iranians are Immigrants from Eastern Africa (5.1%, a difference of 0.16%), Immigrants from Latvia (5.1%, a difference of 0.16%), Kenyan (5.1%, a difference of 0.18%), Immigrants from Kenya (5.1%, a difference of 0.18%), and Immigrants from Eastern Asia (5.1%, a difference of 0.20%). Similarly, the demographic groups most similar to Immigrants from Lithuania are Chilean (5.0%, a difference of 0.0%), South African (5.1%, a difference of 0.16%), Argentinean (5.1%, a difference of 0.19%), Immigrants from Ireland (5.1%, a difference of 0.26%), and Immigrants from Western Europe (5.1%, a difference of 0.47%).
| Demographics | Rating | Rank | Unemployment |
| Immigrants | Lithuania | 93.2 /100 | #110 | Exceptional 5.0% |
| Chileans | 93.2 /100 | #111 | Exceptional 5.0% |
| South Africans | 92.6 /100 | #112 | Exceptional 5.1% |
| Argentineans | 92.4 /100 | #113 | Exceptional 5.1% |
| Immigrants | Ireland | 92.1 /100 | #114 | Exceptional 5.1% |
| Immigrants | Western Europe | 91.1 /100 | #115 | Exceptional 5.1% |
| Immigrants | Sri Lanka | 91.1 /100 | #116 | Exceptional 5.1% |
| Immigrants | Malaysia | 91.0 /100 | #117 | Exceptional 5.1% |
| Immigrants | Germany | 90.8 /100 | #118 | Exceptional 5.1% |
| Immigrants | France | 89.7 /100 | #119 | Excellent 5.1% |
| Macedonians | 89.7 /100 | #120 | Excellent 5.1% |
| Lebanese | 89.2 /100 | #121 | Excellent 5.1% |
| Immigrants | Switzerland | 89.1 /100 | #122 | Excellent 5.1% |
| Asians | 89.0 /100 | #123 | Excellent 5.1% |
| Ethiopians | 88.6 /100 | #124 | Excellent 5.1% |
| Immigrants | Eastern Asia | 88.3 /100 | #125 | Excellent 5.1% |
| Kenyans | 88.2 /100 | #126 | Excellent 5.1% |
| Immigrants | Kenya | 88.2 /100 | #127 | Excellent 5.1% |
| Immigrants | Eastern Africa | 88.1 /100 | #128 | Excellent 5.1% |
| Immigrants | Latvia | 88.0 /100 | #129 | Excellent 5.1% |
| Iranians | 86.9 /100 | #130 | Excellent 5.1% |