American vs Immigrants from Syria Median Female Earnings
COMPARE
American
Immigrants from Syria
Median Female Earnings
Median Female Earnings Comparison
Americans
Immigrants from Syria
$35,777
MEDIAN FEMALE EARNINGS
0.0/ 100
METRIC RATING
292nd/ 347
METRIC RANK
$40,499
MEDIAN FEMALE EARNINGS
84.1/ 100
METRIC RATING
141st/ 347
METRIC RANK
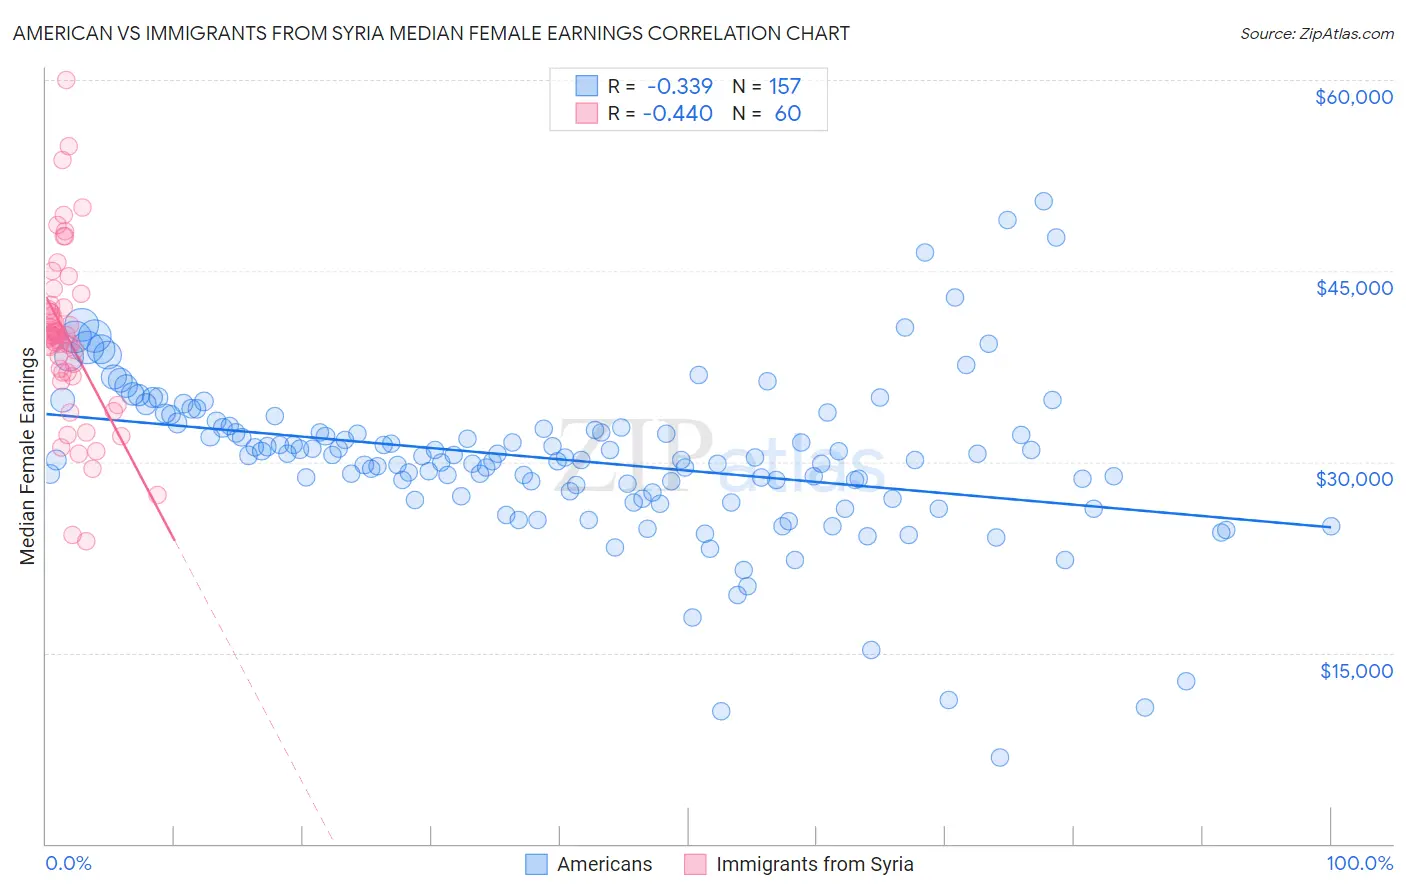
American vs Immigrants from Syria Median Female Earnings Correlation Chart
The statistical analysis conducted on geographies consisting of 579,438,585 people shows a mild negative correlation between the proportion of Americans and median female earnings in the United States with a correlation coefficient (R) of -0.339 and weighted average of $35,777. Similarly, the statistical analysis conducted on geographies consisting of 174,108,598 people shows a moderate negative correlation between the proportion of Immigrants from Syria and median female earnings in the United States with a correlation coefficient (R) of -0.440 and weighted average of $40,499, a difference of 13.2%.
Median Female Earnings Correlation Summary
| Measurement | American | Immigrants from Syria |
| Minimum | $6,772 | $23,750 |
| Maximum | $50,517 | $60,000 |
| Range | $43,745 | $36,250 |
| Mean | $30,170 | $39,767 |
| Median | $30,366 | $39,904 |
| Interquartile 25% (IQ1) | $27,419 | $36,881 |
| Interquartile 75% (IQ3) | $32,737 | $42,187 |
| Interquartile Range (IQR) | $5,318 | $5,305 |
| Standard Deviation (Sample) | $6,408 | $6,836 |
| Standard Deviation (Population) | $6,387 | $6,779 |
Similar Demographics by Median Female Earnings
Demographics Similar to Americans by Median Female Earnings
In terms of median female earnings, the demographic groups most similar to Americans are Guatemalan ($35,695, a difference of 0.23%), Blackfeet ($35,864, a difference of 0.24%), Cheyenne ($35,673, a difference of 0.29%), Comanche ($35,661, a difference of 0.32%), and Mexican American Indian ($35,629, a difference of 0.42%).
| Demographics | Rating | Rank | Median Female Earnings |
| Paiute | 0.1 /100 | #285 | Tragic $36,056 |
| Osage | 0.0 /100 | #286 | Tragic $36,034 |
| Immigrants | Nicaragua | 0.0 /100 | #287 | Tragic $36,023 |
| Immigrants | Zaire | 0.0 /100 | #288 | Tragic $36,017 |
| Bangladeshis | 0.0 /100 | #289 | Tragic $35,960 |
| Central American Indians | 0.0 /100 | #290 | Tragic $35,930 |
| Blackfeet | 0.0 /100 | #291 | Tragic $35,864 |
| Americans | 0.0 /100 | #292 | Tragic $35,777 |
| Guatemalans | 0.0 /100 | #293 | Tragic $35,695 |
| Cheyenne | 0.0 /100 | #294 | Tragic $35,673 |
| Comanche | 0.0 /100 | #295 | Tragic $35,661 |
| Mexican American Indians | 0.0 /100 | #296 | Tragic $35,629 |
| Hmong | 0.0 /100 | #297 | Tragic $35,498 |
| Immigrants | Micronesia | 0.0 /100 | #298 | Tragic $35,477 |
| Immigrants | Guatemala | 0.0 /100 | #299 | Tragic $35,444 |
Demographics Similar to Immigrants from Syria by Median Female Earnings
In terms of median female earnings, the demographic groups most similar to Immigrants from Syria are Sri Lankan ($40,496, a difference of 0.010%), Northern European ($40,491, a difference of 0.020%), Immigrants from North Macedonia ($40,488, a difference of 0.030%), Brazilian ($40,483, a difference of 0.040%), and Serbian ($40,539, a difference of 0.10%).
| Demographics | Rating | Rank | Median Female Earnings |
| Arabs | 89.3 /100 | #134 | Excellent $40,718 |
| Immigrants | Nepal | 89.0 /100 | #135 | Excellent $40,704 |
| Immigrants | Eastern Africa | 87.7 /100 | #136 | Excellent $40,644 |
| Pakistanis | 86.6 /100 | #137 | Excellent $40,596 |
| Taiwanese | 86.1 /100 | #138 | Excellent $40,576 |
| Immigrants | South Eastern Asia | 85.7 /100 | #139 | Excellent $40,558 |
| Serbians | 85.2 /100 | #140 | Excellent $40,539 |
| Immigrants | Syria | 84.1 /100 | #141 | Excellent $40,499 |
| Sri Lankans | 84.0 /100 | #142 | Excellent $40,496 |
| Northern Europeans | 83.9 /100 | #143 | Excellent $40,491 |
| Immigrants | North Macedonia | 83.8 /100 | #144 | Excellent $40,488 |
| Brazilians | 83.6 /100 | #145 | Excellent $40,483 |
| Ghanaians | 82.1 /100 | #146 | Excellent $40,429 |
| Vietnamese | 80.4 /100 | #147 | Excellent $40,377 |
| Poles | 80.2 /100 | #148 | Excellent $40,371 |