Inupiat vs Immigrants from Syria Median Household Income
COMPARE
Inupiat
Immigrants from Syria
Median Household Income
Median Household Income Comparison
Inupiat
Immigrants from Syria
$78,841
MEDIAN HOUSEHOLD INCOME
1.8/ 100
METRIC RATING
245th/ 347
METRIC RANK
$88,792
MEDIAN HOUSEHOLD INCOME
91.4/ 100
METRIC RATING
131st/ 347
METRIC RANK
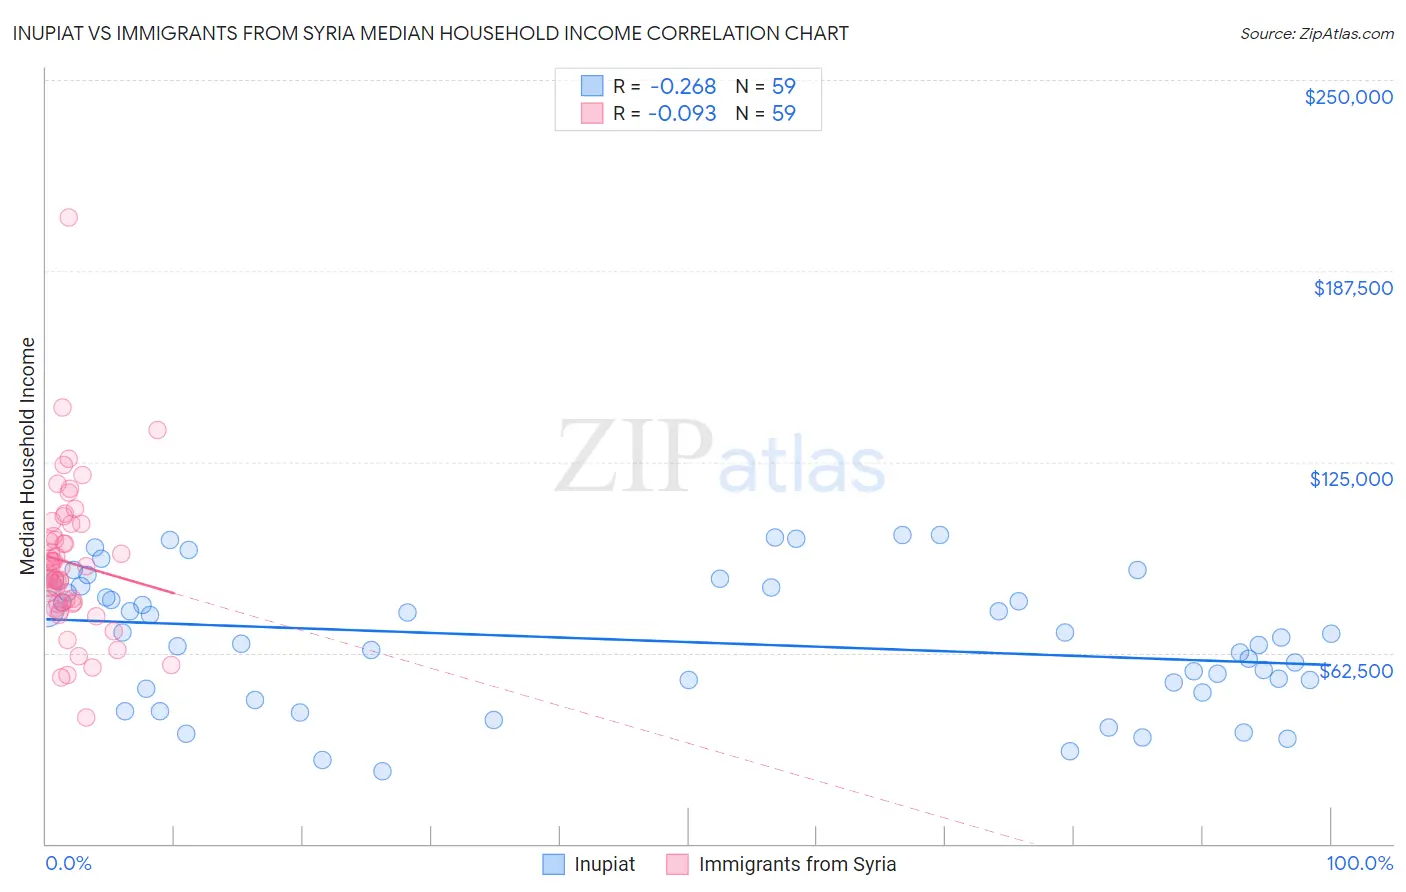
Inupiat vs Immigrants from Syria Median Household Income Correlation Chart
The statistical analysis conducted on geographies consisting of 96,314,941 people shows a weak negative correlation between the proportion of Inupiat and median household income in the United States with a correlation coefficient (R) of -0.268 and weighted average of $78,841. Similarly, the statistical analysis conducted on geographies consisting of 174,102,595 people shows a slight negative correlation between the proportion of Immigrants from Syria and median household income in the United States with a correlation coefficient (R) of -0.093 and weighted average of $88,792, a difference of 12.6%.
Median Household Income Correlation Summary
| Measurement | Inupiat | Immigrants from Syria |
| Minimum | $23,889 | $41,250 |
| Maximum | $101,071 | $204,875 |
| Range | $77,182 | $163,625 |
| Mean | $66,659 | $92,001 |
| Median | $67,500 | $90,604 |
| Interquartile 25% (IQ1) | $50,572 | $78,558 |
| Interquartile 75% (IQ3) | $83,750 | $104,604 |
| Interquartile Range (IQR) | $33,178 | $26,046 |
| Standard Deviation (Sample) | $21,353 | $25,121 |
| Standard Deviation (Population) | $21,171 | $24,907 |
Similar Demographics by Median Household Income
Demographics Similar to Inupiat by Median Household Income
In terms of median household income, the demographic groups most similar to Inupiat are Central American ($78,803, a difference of 0.050%), Marshallese ($78,930, a difference of 0.11%), Immigrants from Barbados ($78,989, a difference of 0.19%), Immigrants from Burma/Myanmar ($78,682, a difference of 0.20%), and Immigrants from Sudan ($79,103, a difference of 0.33%).
| Demographics | Rating | Rank | Median Household Income |
| Barbadians | 3.0 /100 | #238 | Tragic $79,664 |
| Alaska Natives | 2.7 /100 | #239 | Tragic $79,509 |
| Immigrants | Western Africa | 2.7 /100 | #240 | Tragic $79,490 |
| Immigrants | Nonimmigrants | 2.6 /100 | #241 | Tragic $79,429 |
| Immigrants | Sudan | 2.1 /100 | #242 | Tragic $79,103 |
| Immigrants | Barbados | 1.9 /100 | #243 | Tragic $78,989 |
| Marshallese | 1.9 /100 | #244 | Tragic $78,930 |
| Inupiat | 1.8 /100 | #245 | Tragic $78,841 |
| Central Americans | 1.7 /100 | #246 | Tragic $78,803 |
| Immigrants | Burma/Myanmar | 1.6 /100 | #247 | Tragic $78,682 |
| Sudanese | 1.5 /100 | #248 | Tragic $78,529 |
| West Indians | 1.4 /100 | #249 | Tragic $78,455 |
| Immigrants | Laos | 1.3 /100 | #250 | Tragic $78,327 |
| Mexican American Indians | 1.2 /100 | #251 | Tragic $78,166 |
| Immigrants | West Indies | 1.0 /100 | #252 | Tragic $77,956 |
Demographics Similar to Immigrants from Syria by Median Household Income
In terms of median household income, the demographic groups most similar to Immigrants from Syria are European ($88,751, a difference of 0.050%), Immigrants from Ethiopia ($88,687, a difference of 0.12%), British ($88,914, a difference of 0.14%), Brazilian ($88,934, a difference of 0.16%), and Portuguese ($88,976, a difference of 0.21%).
| Demographics | Rating | Rank | Median Household Income |
| Immigrants | Jordan | 94.1 /100 | #124 | Exceptional $89,412 |
| Immigrants | Kuwait | 93.5 /100 | #125 | Exceptional $89,263 |
| Immigrants | Oceania | 92.9 /100 | #126 | Exceptional $89,100 |
| Immigrants | Peru | 92.5 /100 | #127 | Exceptional $89,010 |
| Portuguese | 92.3 /100 | #128 | Exceptional $88,976 |
| Brazilians | 92.1 /100 | #129 | Exceptional $88,934 |
| British | 92.0 /100 | #130 | Exceptional $88,914 |
| Immigrants | Syria | 91.4 /100 | #131 | Exceptional $88,792 |
| Europeans | 91.2 /100 | #132 | Exceptional $88,751 |
| Immigrants | Ethiopia | 90.9 /100 | #133 | Exceptional $88,687 |
| Swedes | 90.0 /100 | #134 | Exceptional $88,524 |
| Immigrants | Sierra Leone | 89.9 /100 | #135 | Excellent $88,498 |
| Poles | 89.7 /100 | #136 | Excellent $88,472 |
| Sierra Leoneans | 89.6 /100 | #137 | Excellent $88,463 |
| Arabs | 89.2 /100 | #138 | Excellent $88,398 |