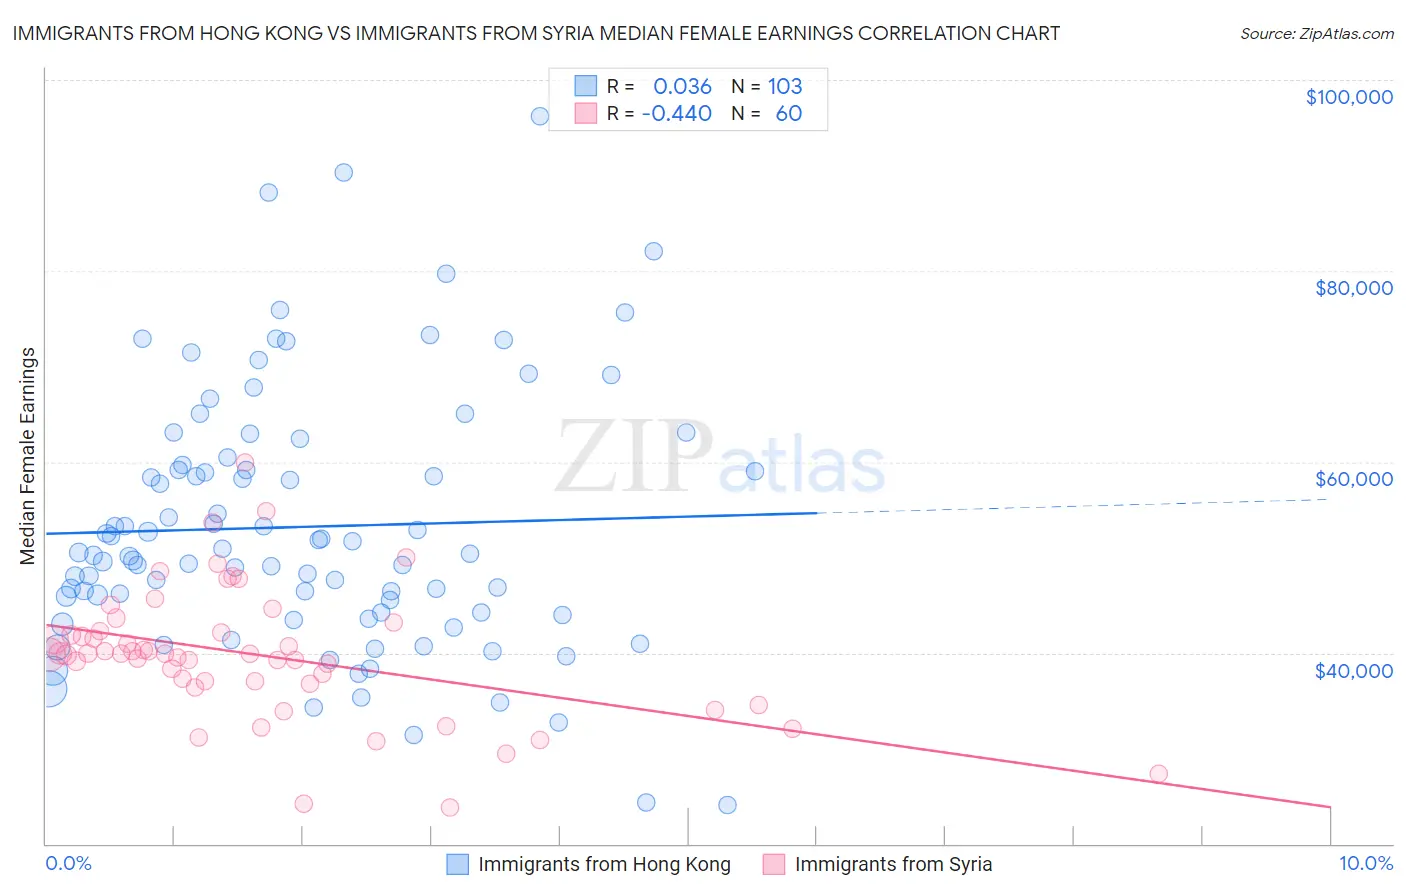
Immigrants from Hong Kong vs Immigrants from Syria Median Female Earnings
COMPARE
Immigrants from Hong Kong
Immigrants from Syria
Median Female Earnings
Median Female Earnings Comparison
Immigrants from Hong Kong
Immigrants from Syria
$49,818
MEDIAN FEMALE EARNINGS
100.0/ 100
METRIC RATING
1st/ 347
METRIC RANK
$40,499
MEDIAN FEMALE EARNINGS
84.1/ 100
METRIC RATING
141st/ 347
METRIC RANK
Immigrants from Hong Kong vs Immigrants from Syria Median Female Earnings Correlation Chart
The statistical analysis conducted on geographies consisting of 253,932,744 people shows no correlation between the proportion of Immigrants from Hong Kong and median female earnings in the United States with a correlation coefficient (R) of 0.036 and weighted average of $49,818. Similarly, the statistical analysis conducted on geographies consisting of 174,108,598 people shows a moderate negative correlation between the proportion of Immigrants from Syria and median female earnings in the United States with a correlation coefficient (R) of -0.440 and weighted average of $40,499, a difference of 23.0%.
Median Female Earnings Correlation Summary
| Measurement | Immigrants from Hong Kong | Immigrants from Syria |
| Minimum | $24,038 | $23,750 |
| Maximum | $96,250 | $60,000 |
| Range | $72,212 | $36,250 |
| Mean | $53,195 | $39,767 |
| Median | $50,354 | $39,904 |
| Interquartile 25% (IQ1) | $44,209 | $36,881 |
| Interquartile 75% (IQ3) | $59,618 | $42,187 |
| Interquartile Range (IQR) | $15,409 | $5,305 |
| Standard Deviation (Sample) | $13,646 | $6,836 |
| Standard Deviation (Population) | $13,580 | $6,779 |
Similar Demographics by Median Female Earnings
Demographics Similar to Immigrants from Hong Kong by Median Female Earnings
In terms of median female earnings, the demographic groups most similar to Immigrants from Hong Kong are Filipino ($49,508, a difference of 0.63%), Immigrants from Taiwan ($49,256, a difference of 1.1%), Immigrants from India ($48,292, a difference of 3.2%), Immigrants from Singapore ($47,986, a difference of 3.8%), and Immigrants from Ireland ($47,598, a difference of 4.7%).
| Demographics | Rating | Rank | Median Female Earnings |
| Immigrants | Hong Kong | 100.0 /100 | #1 | Exceptional $49,818 |
| Filipinos | 100.0 /100 | #2 | Exceptional $49,508 |
| Immigrants | Taiwan | 100.0 /100 | #3 | Exceptional $49,256 |
| Immigrants | India | 100.0 /100 | #4 | Exceptional $48,292 |
| Immigrants | Singapore | 100.0 /100 | #5 | Exceptional $47,986 |
| Immigrants | Ireland | 100.0 /100 | #6 | Exceptional $47,598 |
| Thais | 100.0 /100 | #7 | Exceptional $47,577 |
| Iranians | 100.0 /100 | #8 | Exceptional $47,421 |
| Immigrants | Iran | 100.0 /100 | #9 | Exceptional $47,154 |
| Immigrants | China | 100.0 /100 | #10 | Exceptional $46,972 |
| Okinawans | 100.0 /100 | #11 | Exceptional $46,905 |
| Immigrants | Israel | 100.0 /100 | #12 | Exceptional $46,902 |
| Immigrants | Australia | 100.0 /100 | #13 | Exceptional $46,573 |
| Soviet Union | 100.0 /100 | #14 | Exceptional $46,556 |
| Immigrants | Eastern Asia | 100.0 /100 | #15 | Exceptional $46,502 |
Demographics Similar to Immigrants from Syria by Median Female Earnings
In terms of median female earnings, the demographic groups most similar to Immigrants from Syria are Sri Lankan ($40,496, a difference of 0.010%), Northern European ($40,491, a difference of 0.020%), Immigrants from North Macedonia ($40,488, a difference of 0.030%), Brazilian ($40,483, a difference of 0.040%), and Serbian ($40,539, a difference of 0.10%).
| Demographics | Rating | Rank | Median Female Earnings |
| Arabs | 89.3 /100 | #134 | Excellent $40,718 |
| Immigrants | Nepal | 89.0 /100 | #135 | Excellent $40,704 |
| Immigrants | Eastern Africa | 87.7 /100 | #136 | Excellent $40,644 |
| Pakistanis | 86.6 /100 | #137 | Excellent $40,596 |
| Taiwanese | 86.1 /100 | #138 | Excellent $40,576 |
| Immigrants | South Eastern Asia | 85.7 /100 | #139 | Excellent $40,558 |
| Serbians | 85.2 /100 | #140 | Excellent $40,539 |
| Immigrants | Syria | 84.1 /100 | #141 | Excellent $40,499 |
| Sri Lankans | 84.0 /100 | #142 | Excellent $40,496 |
| Northern Europeans | 83.9 /100 | #143 | Excellent $40,491 |
| Immigrants | North Macedonia | 83.8 /100 | #144 | Excellent $40,488 |
| Brazilians | 83.6 /100 | #145 | Excellent $40,483 |
| Ghanaians | 82.1 /100 | #146 | Excellent $40,429 |
| Vietnamese | 80.4 /100 | #147 | Excellent $40,377 |
| Poles | 80.2 /100 | #148 | Excellent $40,371 |