Sri Lankan vs Immigrants from Syria Median Female Earnings
COMPARE
Sri Lankan
Immigrants from Syria
Median Female Earnings
Median Female Earnings Comparison
Sri Lankans
Immigrants from Syria
$40,496
MEDIAN FEMALE EARNINGS
84.0/ 100
METRIC RATING
142nd/ 347
METRIC RANK
$40,499
MEDIAN FEMALE EARNINGS
84.1/ 100
METRIC RATING
141st/ 347
METRIC RANK
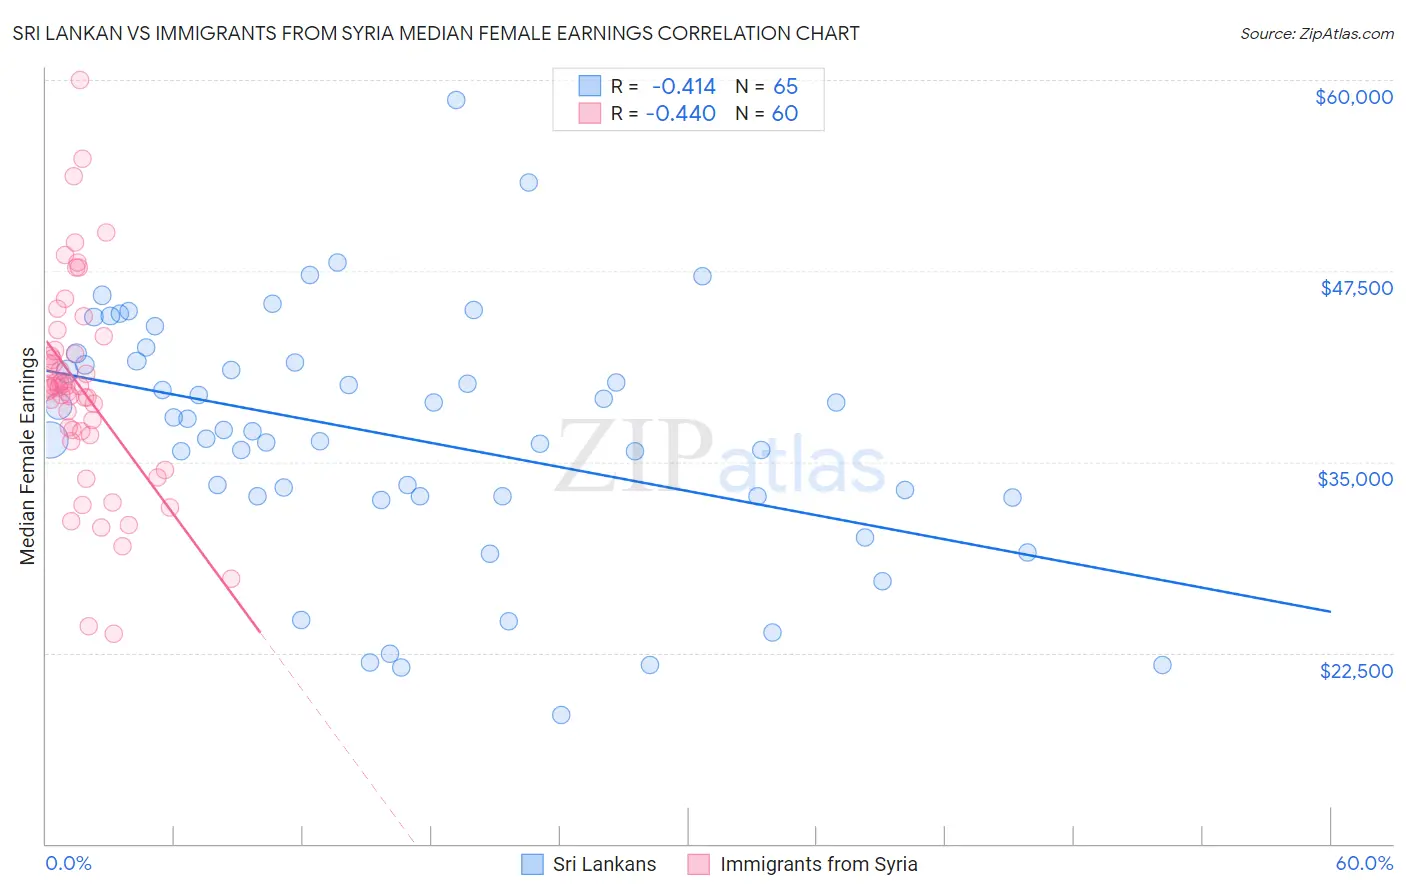
Sri Lankan vs Immigrants from Syria Median Female Earnings Correlation Chart
The statistical analysis conducted on geographies consisting of 440,466,993 people shows a moderate negative correlation between the proportion of Sri Lankans and median female earnings in the United States with a correlation coefficient (R) of -0.414 and weighted average of $40,496. Similarly, the statistical analysis conducted on geographies consisting of 174,108,598 people shows a moderate negative correlation between the proportion of Immigrants from Syria and median female earnings in the United States with a correlation coefficient (R) of -0.440 and weighted average of $40,499, a difference of 0.010%.
Median Female Earnings Correlation Summary
| Measurement | Sri Lankan | Immigrants from Syria |
| Minimum | $18,441 | $23,750 |
| Maximum | $58,654 | $60,000 |
| Range | $40,213 | $36,250 |
| Mean | $36,602 | $39,767 |
| Median | $36,994 | $39,904 |
| Interquartile 25% (IQ1) | $32,729 | $36,881 |
| Interquartile 75% (IQ3) | $41,553 | $42,187 |
| Interquartile Range (IQR) | $8,824 | $5,305 |
| Standard Deviation (Sample) | $8,074 | $6,836 |
| Standard Deviation (Population) | $8,012 | $6,779 |
Demographics Similar to Sri Lankans and Immigrants from Syria by Median Female Earnings
In terms of median female earnings, the demographic groups most similar to Sri Lankans are Northern European ($40,491, a difference of 0.010%), Immigrants from North Macedonia ($40,488, a difference of 0.020%), Brazilian ($40,483, a difference of 0.030%), Serbian ($40,539, a difference of 0.10%), and Immigrants from South Eastern Asia ($40,558, a difference of 0.15%). Similarly, the demographic groups most similar to Immigrants from Syria are Northern European ($40,491, a difference of 0.020%), Immigrants from North Macedonia ($40,488, a difference of 0.030%), Brazilian ($40,483, a difference of 0.040%), Serbian ($40,539, a difference of 0.10%), and Immigrants from South Eastern Asia ($40,558, a difference of 0.15%).
| Demographics | Rating | Rank | Median Female Earnings |
| Chileans | 90.0 /100 | #131 | Exceptional $40,757 |
| Immigrants | Uganda | 89.7 /100 | #132 | Excellent $40,739 |
| Syrians | 89.5 /100 | #133 | Excellent $40,727 |
| Arabs | 89.3 /100 | #134 | Excellent $40,718 |
| Immigrants | Nepal | 89.0 /100 | #135 | Excellent $40,704 |
| Immigrants | Eastern Africa | 87.7 /100 | #136 | Excellent $40,644 |
| Pakistanis | 86.6 /100 | #137 | Excellent $40,596 |
| Taiwanese | 86.1 /100 | #138 | Excellent $40,576 |
| Immigrants | South Eastern Asia | 85.7 /100 | #139 | Excellent $40,558 |
| Serbians | 85.2 /100 | #140 | Excellent $40,539 |
| Immigrants | Syria | 84.1 /100 | #141 | Excellent $40,499 |
| Sri Lankans | 84.0 /100 | #142 | Excellent $40,496 |
| Northern Europeans | 83.9 /100 | #143 | Excellent $40,491 |
| Immigrants | North Macedonia | 83.8 /100 | #144 | Excellent $40,488 |
| Brazilians | 83.6 /100 | #145 | Excellent $40,483 |
| Ghanaians | 82.1 /100 | #146 | Excellent $40,429 |
| Vietnamese | 80.4 /100 | #147 | Excellent $40,377 |
| Poles | 80.2 /100 | #148 | Excellent $40,371 |
| Immigrants | Cameroon | 79.7 /100 | #149 | Good $40,354 |
| Immigrants | Chile | 79.6 /100 | #150 | Good $40,353 |
| Immigrants | Armenia | 79.2 /100 | #151 | Good $40,340 |