Inupiat vs Immigrants from Syria In Labor Force | Age 30-34
COMPARE
Inupiat
Immigrants from Syria
In Labor Force | Age 30-34
In Labor Force | Age 30-34 Comparison
Inupiat
Immigrants from Syria
79.7%
IN LABOR FORCE | AGE 30-34
0.0/ 100
METRIC RATING
333rd/ 347
METRIC RANK
84.5%
IN LABOR FORCE | AGE 30-34
21.9/ 100
METRIC RATING
197th/ 347
METRIC RANK
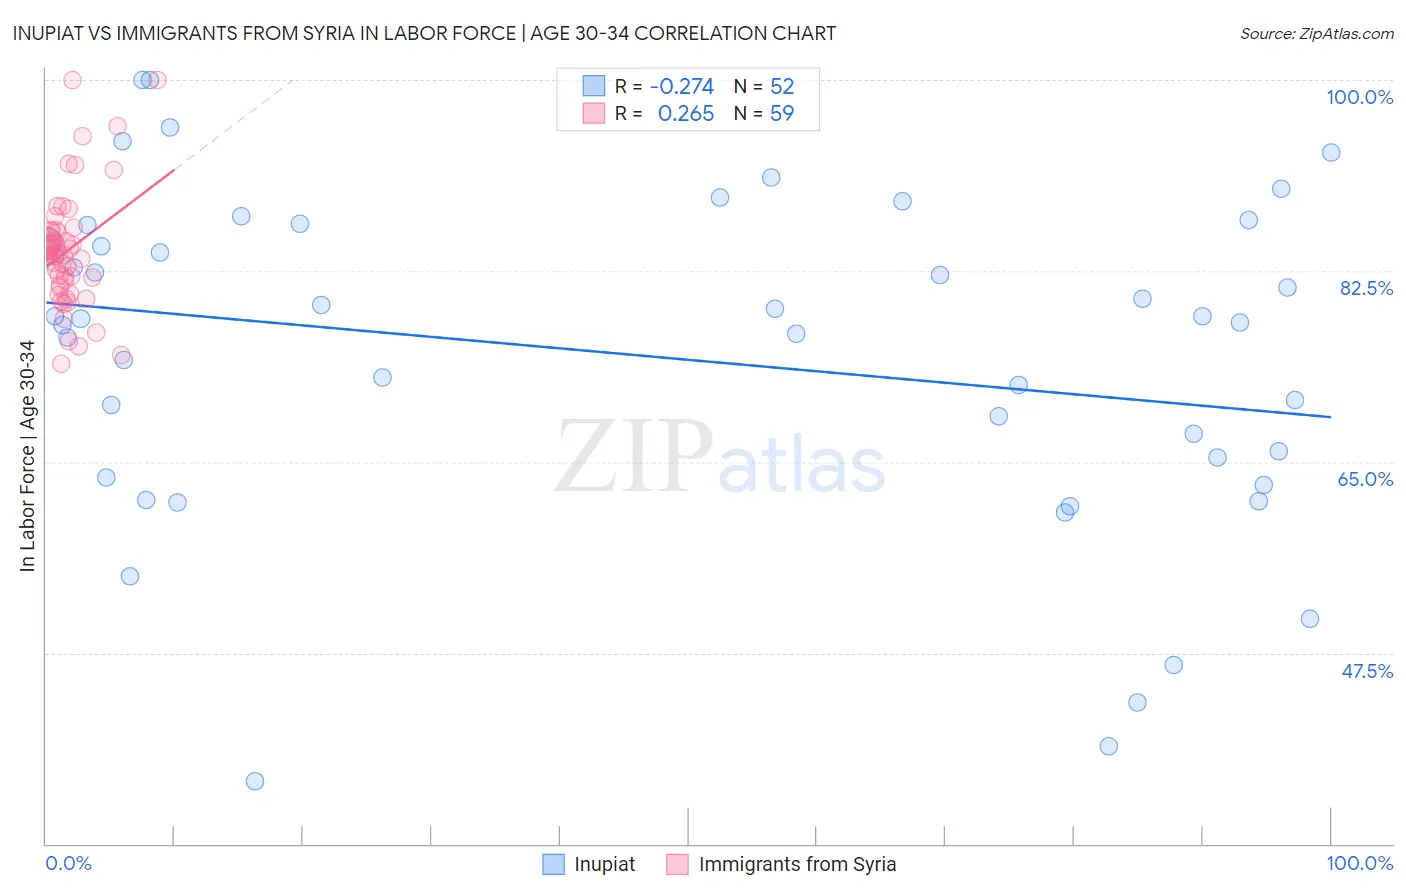
Inupiat vs Immigrants from Syria In Labor Force | Age 30-34 Correlation Chart
The statistical analysis conducted on geographies consisting of 96,336,541 people shows a weak negative correlation between the proportion of Inupiat and labor force participation rate among population between the ages 30 and 34 in the United States with a correlation coefficient (R) of -0.274 and weighted average of 79.7%. Similarly, the statistical analysis conducted on geographies consisting of 174,094,070 people shows a weak positive correlation between the proportion of Immigrants from Syria and labor force participation rate among population between the ages 30 and 34 in the United States with a correlation coefficient (R) of 0.265 and weighted average of 84.5%, a difference of 6.0%.
In Labor Force | Age 30-34 Correlation Summary
| Measurement | Inupiat | Immigrants from Syria |
| Minimum | 35.7% | 74.0% |
| Maximum | 100.0% | 100.0% |
| Range | 64.3% | 26.0% |
| Mean | 74.7% | 84.3% |
| Median | 78.0% | 84.1% |
| Interquartile 25% (IQ1) | 64.5% | 81.2% |
| Interquartile 75% (IQ3) | 85.7% | 86.1% |
| Interquartile Range (IQR) | 21.3% | 4.9% |
| Standard Deviation (Sample) | 15.1% | 5.3% |
| Standard Deviation (Population) | 15.0% | 5.3% |
Similar Demographics by In Labor Force | Age 30-34
Demographics Similar to Inupiat by In Labor Force | Age 30-34
In terms of in labor force | age 30-34, the demographic groups most similar to Inupiat are Kiowa (79.8%, a difference of 0.12%), Houma (79.9%, a difference of 0.22%), Pueblo (80.0%, a difference of 0.40%), Hopi (79.3%, a difference of 0.58%), and Marshallese (79.2%, a difference of 0.62%).
| Demographics | Rating | Rank | In Labor Force | Age 30-34 |
| Seminole | 0.0 /100 | #326 | Tragic 80.8% |
| Colville | 0.0 /100 | #327 | Tragic 80.7% |
| Sioux | 0.0 /100 | #328 | Tragic 80.4% |
| Creek | 0.0 /100 | #329 | Tragic 80.4% |
| Pueblo | 0.0 /100 | #330 | Tragic 80.0% |
| Houma | 0.0 /100 | #331 | Tragic 79.9% |
| Kiowa | 0.0 /100 | #332 | Tragic 79.8% |
| Inupiat | 0.0 /100 | #333 | Tragic 79.7% |
| Hopi | 0.0 /100 | #334 | Tragic 79.3% |
| Marshallese | 0.0 /100 | #335 | Tragic 79.2% |
| Natives/Alaskans | 0.0 /100 | #336 | Tragic 79.2% |
| Yakama | 0.0 /100 | #337 | Tragic 79.1% |
| Pima | 0.0 /100 | #338 | Tragic 79.0% |
| Apache | 0.0 /100 | #339 | Tragic 79.0% |
| Ute | 0.0 /100 | #340 | Tragic 78.9% |
Demographics Similar to Immigrants from Syria by In Labor Force | Age 30-34
In terms of in labor force | age 30-34, the demographic groups most similar to Immigrants from Syria are Korean (84.5%, a difference of 0.010%), British (84.5%, a difference of 0.010%), Immigrants from Costa Rica (84.5%, a difference of 0.020%), Immigrants from Afghanistan (84.5%, a difference of 0.020%), and Dutch (84.5%, a difference of 0.020%).
| Demographics | Rating | Rank | In Labor Force | Age 30-34 |
| Immigrants | Zaire | 25.8 /100 | #190 | Fair 84.5% |
| Hungarians | 24.8 /100 | #191 | Fair 84.5% |
| Scandinavians | 24.7 /100 | #192 | Fair 84.5% |
| Immigrants | Costa Rica | 23.9 /100 | #193 | Fair 84.5% |
| Immigrants | Afghanistan | 23.5 /100 | #194 | Fair 84.5% |
| Koreans | 23.2 /100 | #195 | Fair 84.5% |
| British | 22.9 /100 | #196 | Fair 84.5% |
| Immigrants | Syria | 21.9 /100 | #197 | Fair 84.5% |
| Dutch | 20.2 /100 | #198 | Fair 84.5% |
| Immigrants | Thailand | 19.1 /100 | #199 | Poor 84.5% |
| Sub-Saharan Africans | 19.0 /100 | #200 | Poor 84.5% |
| Trinidadians and Tobagonians | 18.2 /100 | #201 | Poor 84.5% |
| Immigrants | West Indies | 18.1 /100 | #202 | Poor 84.5% |
| Canadians | 15.4 /100 | #203 | Poor 84.4% |
| Ecuadorians | 14.2 /100 | #204 | Poor 84.4% |