Cape Verdean vs Immigrants from Central America Per Capita Income
COMPARE
Cape Verdean
Immigrants from Central America
Per Capita Income
Per Capita Income Comparison
Cape Verdeans
Immigrants from Central America
$39,935
PER CAPITA INCOME
1.5/ 100
METRIC RATING
248th/ 347
METRIC RANK
$34,974
PER CAPITA INCOME
0.0/ 100
METRIC RATING
325th/ 347
METRIC RANK
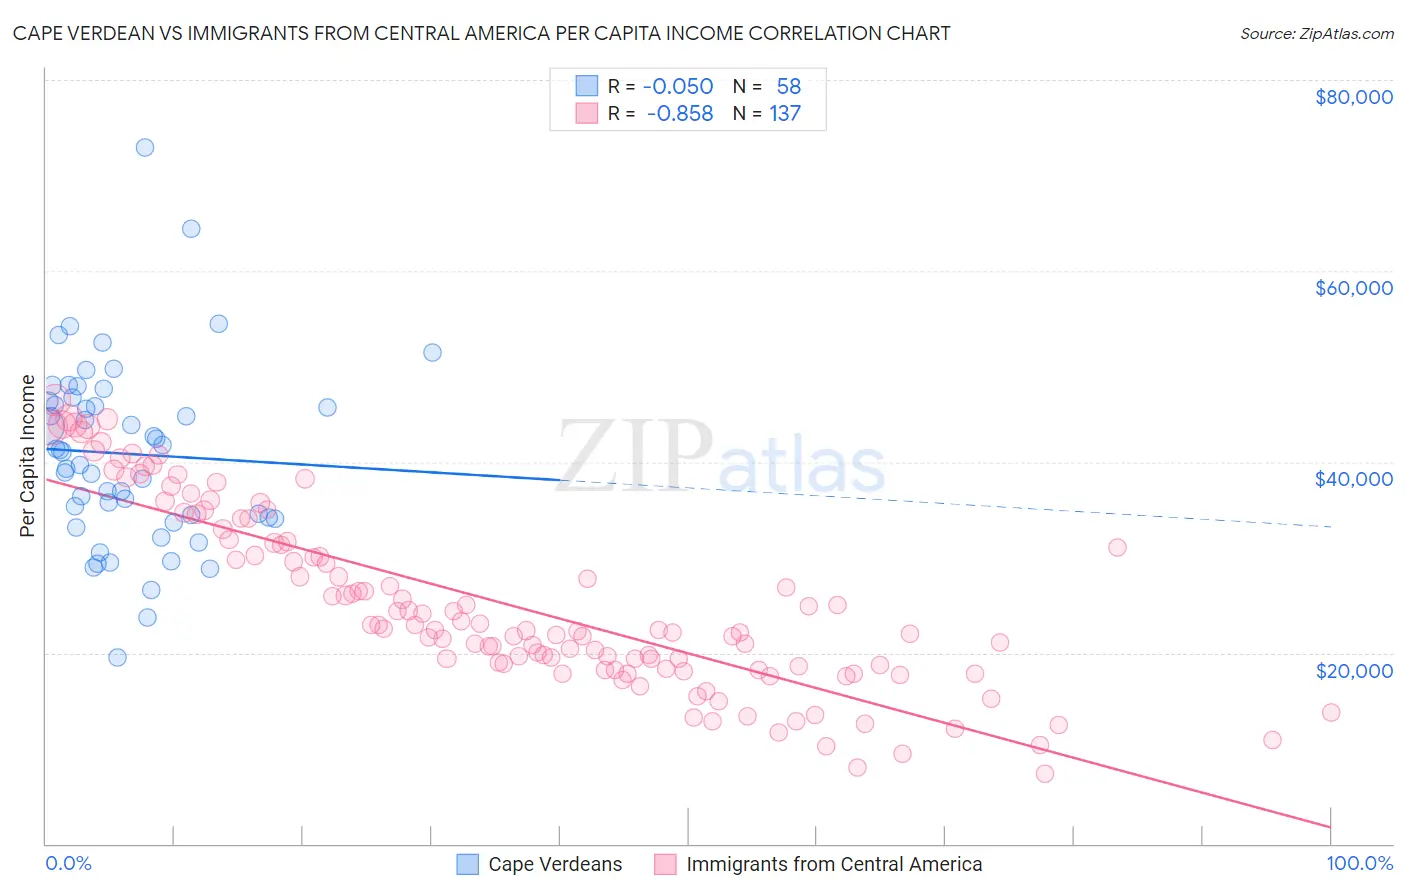
Cape Verdean vs Immigrants from Central America Per Capita Income Correlation Chart
The statistical analysis conducted on geographies consisting of 107,581,213 people shows no correlation between the proportion of Cape Verdeans and per capita income in the United States with a correlation coefficient (R) of -0.050 and weighted average of $39,935. Similarly, the statistical analysis conducted on geographies consisting of 536,571,616 people shows a very strong negative correlation between the proportion of Immigrants from Central America and per capita income in the United States with a correlation coefficient (R) of -0.858 and weighted average of $34,974, a difference of 14.2%.
Per Capita Income Correlation Summary
| Measurement | Cape Verdean | Immigrants from Central America |
| Minimum | $19,552 | $7,365 |
| Maximum | $72,967 | $46,418 |
| Range | $53,415 | $39,053 |
| Mean | $40,842 | $25,175 |
| Median | $41,136 | $22,366 |
| Interquartile 25% (IQ1) | $34,180 | $18,495 |
| Interquartile 75% (IQ3) | $46,319 | $31,763 |
| Interquartile Range (IQR) | $12,139 | $13,268 |
| Standard Deviation (Sample) | $9,616 | $9,475 |
| Standard Deviation (Population) | $9,533 | $9,440 |
Similar Demographics by Per Capita Income
Demographics Similar to Cape Verdeans by Per Capita Income
In terms of per capita income, the demographic groups most similar to Cape Verdeans are Immigrants from Somalia ($39,974, a difference of 0.10%), Japanese ($39,870, a difference of 0.16%), Immigrants from Burma/Myanmar ($39,827, a difference of 0.27%), Samoan ($39,826, a difference of 0.27%), and Cree ($40,056, a difference of 0.30%).
| Demographics | Rating | Rank | Per Capita Income |
| British West Indians | 2.3 /100 | #241 | Tragic $40,330 |
| Immigrants | Western Africa | 2.2 /100 | #242 | Tragic $40,294 |
| German Russians | 2.2 /100 | #243 | Tragic $40,266 |
| French American Indians | 2.1 /100 | #244 | Tragic $40,244 |
| Sub-Saharan Africans | 1.9 /100 | #245 | Tragic $40,152 |
| Cree | 1.7 /100 | #246 | Tragic $40,056 |
| Immigrants | Somalia | 1.6 /100 | #247 | Tragic $39,974 |
| Cape Verdeans | 1.5 /100 | #248 | Tragic $39,935 |
| Japanese | 1.4 /100 | #249 | Tragic $39,870 |
| Immigrants | Burma/Myanmar | 1.3 /100 | #250 | Tragic $39,827 |
| Samoans | 1.3 /100 | #251 | Tragic $39,826 |
| Immigrants | Azores | 1.0 /100 | #252 | Tragic $39,608 |
| Osage | 1.0 /100 | #253 | Tragic $39,568 |
| Alaska Natives | 1.0 /100 | #254 | Tragic $39,558 |
| Immigrants | Middle Africa | 1.0 /100 | #255 | Tragic $39,529 |
Demographics Similar to Immigrants from Central America by Per Capita Income
In terms of per capita income, the demographic groups most similar to Immigrants from Central America are Immigrants from Cuba ($34,910, a difference of 0.18%), Apache ($34,886, a difference of 0.25%), Kiowa ($35,102, a difference of 0.37%), Cheyenne ($35,276, a difference of 0.87%), and Menominee ($34,578, a difference of 1.1%).
| Demographics | Rating | Rank | Per Capita Income |
| Bangladeshis | 0.0 /100 | #318 | Tragic $35,897 |
| Immigrants | Congo | 0.0 /100 | #319 | Tragic $35,720 |
| Hispanics or Latinos | 0.0 /100 | #320 | Tragic $35,688 |
| Blacks/African Americans | 0.0 /100 | #321 | Tragic $35,564 |
| Creek | 0.0 /100 | #322 | Tragic $35,546 |
| Cheyenne | 0.0 /100 | #323 | Tragic $35,276 |
| Kiowa | 0.0 /100 | #324 | Tragic $35,102 |
| Immigrants | Central America | 0.0 /100 | #325 | Tragic $34,974 |
| Immigrants | Cuba | 0.0 /100 | #326 | Tragic $34,910 |
| Apache | 0.0 /100 | #327 | Tragic $34,886 |
| Menominee | 0.0 /100 | #328 | Tragic $34,578 |
| Mexicans | 0.0 /100 | #329 | Tragic $34,559 |
| Spanish American Indians | 0.0 /100 | #330 | Tragic $34,195 |
| Immigrants | Mexico | 0.0 /100 | #331 | Tragic $33,931 |
| Sioux | 0.0 /100 | #332 | Tragic $33,921 |