Inupiat vs Immigrants from Austria Householder Income Over 65 years
COMPARE
Inupiat
Immigrants from Austria
Householder Income Over 65 years
Householder Income Over 65 years Comparison
Inupiat
Immigrants from Austria
$61,061
HOUSEHOLDER INCOME OVER 65 YEARS
52.4/ 100
METRIC RATING
171st/ 347
METRIC RANK
$68,208
HOUSEHOLDER INCOME OVER 65 YEARS
99.9/ 100
METRIC RATING
36th/ 347
METRIC RANK
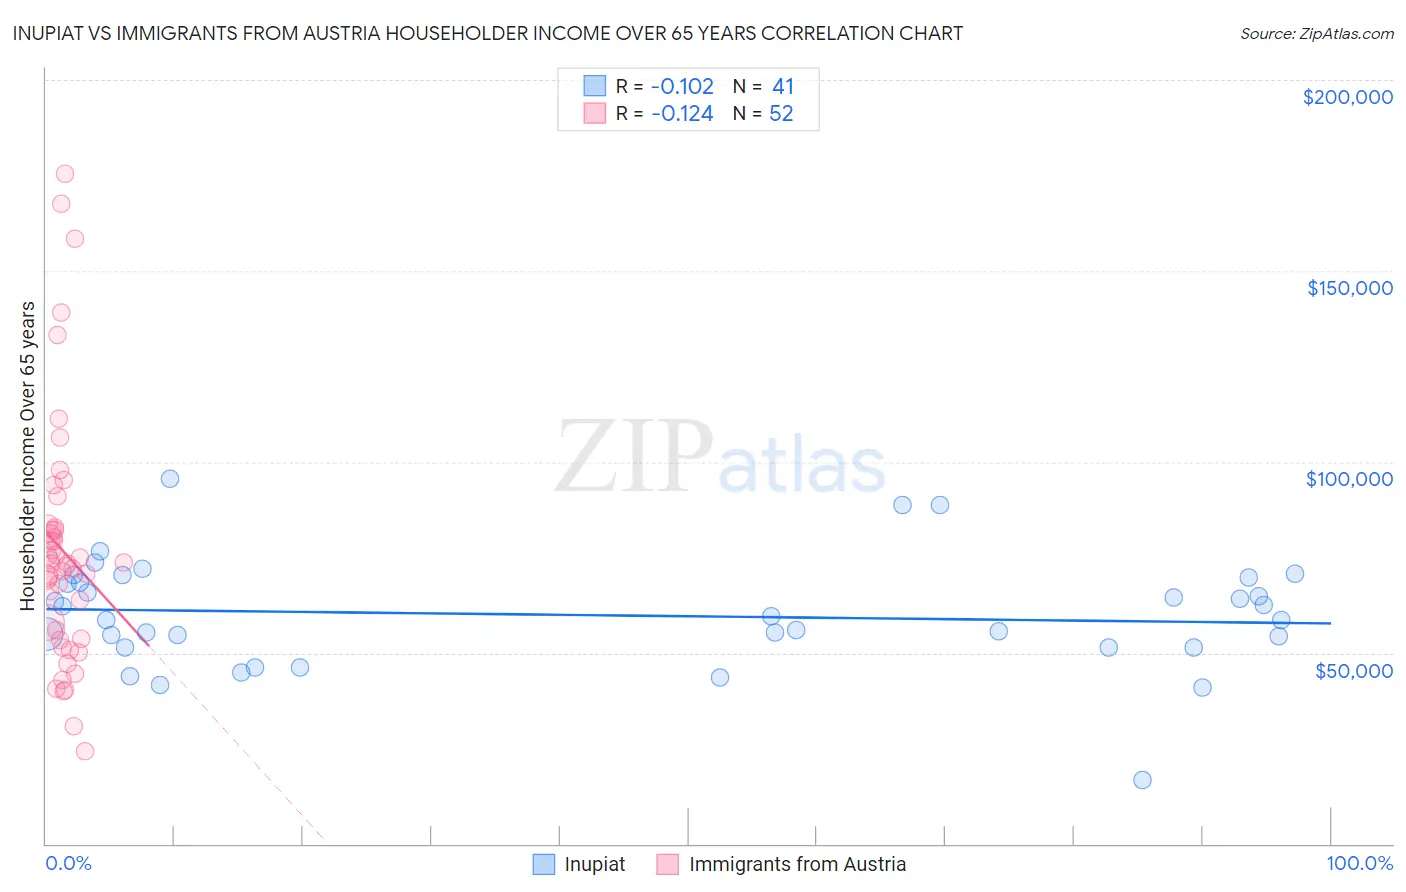
Inupiat vs Immigrants from Austria Householder Income Over 65 years Correlation Chart
The statistical analysis conducted on geographies consisting of 96,206,206 people shows a poor negative correlation between the proportion of Inupiat and household income with householder over the age of 65 in the United States with a correlation coefficient (R) of -0.102 and weighted average of $61,061. Similarly, the statistical analysis conducted on geographies consisting of 167,869,207 people shows a poor negative correlation between the proportion of Immigrants from Austria and household income with householder over the age of 65 in the United States with a correlation coefficient (R) of -0.124 and weighted average of $68,208, a difference of 11.7%.
Householder Income Over 65 years Correlation Summary
| Measurement | Inupiat | Immigrants from Austria |
| Minimum | $16,607 | $24,219 |
| Maximum | $95,647 | $175,333 |
| Range | $79,040 | $151,114 |
| Mean | $59,905 | $76,822 |
| Median | $58,687 | $73,285 |
| Interquartile 25% (IQ1) | $51,307 | $54,783 |
| Interquartile 75% (IQ3) | $69,101 | $82,422 |
| Interquartile Range (IQR) | $17,794 | $27,639 |
| Standard Deviation (Sample) | $14,461 | $31,868 |
| Standard Deviation (Population) | $14,284 | $31,560 |
Similar Demographics by Householder Income Over 65 years
Demographics Similar to Inupiat by Householder Income Over 65 years
In terms of householder income over 65 years, the demographic groups most similar to Inupiat are Immigrants from Poland ($61,041, a difference of 0.030%), Serbian ($61,087, a difference of 0.040%), Carpatho Rusyn ($61,093, a difference of 0.050%), Irish ($61,097, a difference of 0.060%), and Norwegian ($61,104, a difference of 0.070%).
| Demographics | Rating | Rank | Householder Income Over 65 years |
| Immigrants | North Macedonia | 55.4 /100 | #164 | Average $61,175 |
| Immigrants | Ukraine | 55.1 /100 | #165 | Average $61,163 |
| Immigrants | Eastern Africa | 55.0 /100 | #166 | Average $61,157 |
| Norwegians | 53.6 /100 | #167 | Average $61,104 |
| Irish | 53.4 /100 | #168 | Average $61,097 |
| Carpatho Rusyns | 53.3 /100 | #169 | Average $61,093 |
| Serbians | 53.1 /100 | #170 | Average $61,087 |
| Inupiat | 52.4 /100 | #171 | Average $61,061 |
| Immigrants | Poland | 51.9 /100 | #172 | Average $61,041 |
| Immigrants | Micronesia | 50.8 /100 | #173 | Average $61,000 |
| Luxembourgers | 50.0 /100 | #174 | Average $60,967 |
| Spaniards | 47.3 /100 | #175 | Average $60,866 |
| Spanish | 45.5 /100 | #176 | Average $60,795 |
| Alaska Natives | 44.3 /100 | #177 | Average $60,748 |
| Yup'ik | 43.7 /100 | #178 | Average $60,727 |
Demographics Similar to Immigrants from Austria by Householder Income Over 65 years
In terms of householder income over 65 years, the demographic groups most similar to Immigrants from Austria are Tongan ($68,235, a difference of 0.040%), Turkish ($68,037, a difference of 0.25%), Immigrants from Ireland ($68,495, a difference of 0.42%), Estonian ($67,926, a difference of 0.42%), and Russian ($67,626, a difference of 0.86%).
| Demographics | Rating | Rank | Householder Income Over 65 years |
| Immigrants | Australia | 100.0 /100 | #29 | Exceptional $69,164 |
| Immigrants | Northern Europe | 100.0 /100 | #30 | Exceptional $69,003 |
| Afghans | 100.0 /100 | #31 | Exceptional $68,951 |
| Asians | 100.0 /100 | #32 | Exceptional $68,822 |
| Immigrants | Denmark | 100.0 /100 | #33 | Exceptional $68,801 |
| Immigrants | Ireland | 100.0 /100 | #34 | Exceptional $68,495 |
| Tongans | 100.0 /100 | #35 | Exceptional $68,235 |
| Immigrants | Austria | 99.9 /100 | #36 | Exceptional $68,208 |
| Turks | 99.9 /100 | #37 | Exceptional $68,037 |
| Estonians | 99.9 /100 | #38 | Exceptional $67,926 |
| Russians | 99.9 /100 | #39 | Exceptional $67,626 |
| Immigrants | Asia | 99.9 /100 | #40 | Exceptional $67,594 |
| Koreans | 99.9 /100 | #41 | Exceptional $67,472 |
| New Zealanders | 99.9 /100 | #42 | Exceptional $67,333 |
| Latvians | 99.9 /100 | #43 | Exceptional $67,326 |