Inupiat vs Ghanaian Householder Income Over 65 years
COMPARE
Inupiat
Ghanaian
Householder Income Over 65 years
Householder Income Over 65 years Comparison
Inupiat
Ghanaians
$61,061
HOUSEHOLDER INCOME OVER 65 YEARS
52.4/ 100
METRIC RATING
171st/ 347
METRIC RANK
$60,043
HOUSEHOLDER INCOME OVER 65 YEARS
27.5/ 100
METRIC RATING
189th/ 347
METRIC RANK
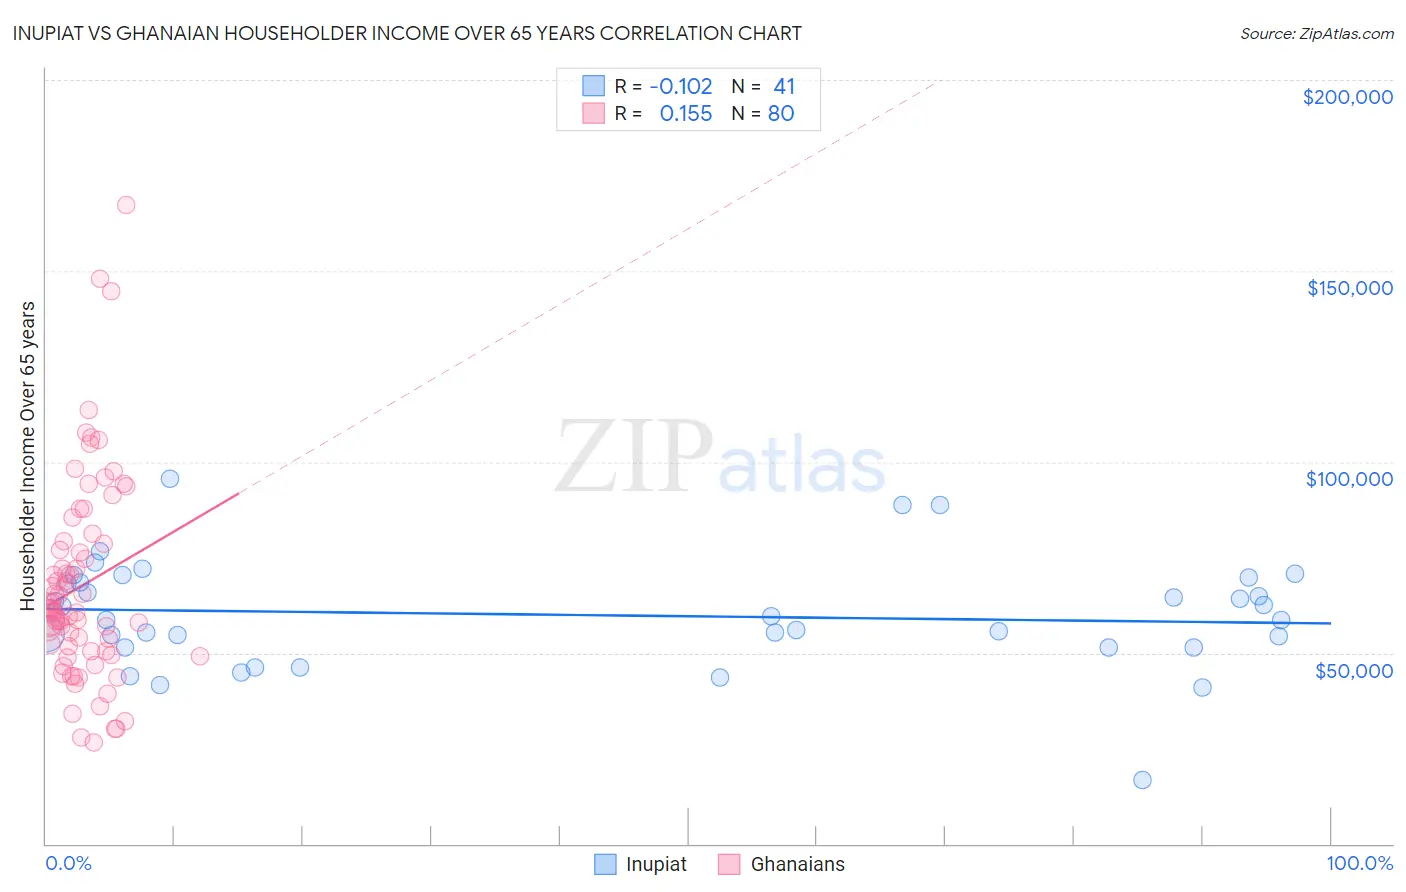
Inupiat vs Ghanaian Householder Income Over 65 years Correlation Chart
The statistical analysis conducted on geographies consisting of 96,206,206 people shows a poor negative correlation between the proportion of Inupiat and household income with householder over the age of 65 in the United States with a correlation coefficient (R) of -0.102 and weighted average of $61,061. Similarly, the statistical analysis conducted on geographies consisting of 190,075,998 people shows a poor positive correlation between the proportion of Ghanaians and household income with householder over the age of 65 in the United States with a correlation coefficient (R) of 0.155 and weighted average of $60,043, a difference of 1.7%.
Householder Income Over 65 years Correlation Summary
| Measurement | Inupiat | Ghanaian |
| Minimum | $16,607 | $26,429 |
| Maximum | $95,647 | $167,368 |
| Range | $79,040 | $140,939 |
| Mean | $59,905 | $67,634 |
| Median | $58,687 | $61,218 |
| Interquartile 25% (IQ1) | $51,307 | $50,453 |
| Interquartile 75% (IQ3) | $69,101 | $78,943 |
| Interquartile Range (IQR) | $17,794 | $28,490 |
| Standard Deviation (Sample) | $14,461 | $26,645 |
| Standard Deviation (Population) | $14,284 | $26,478 |
Demographics Similar to Inupiat and Ghanaians by Householder Income Over 65 years
In terms of householder income over 65 years, the demographic groups most similar to Inupiat are Immigrants from Poland ($61,041, a difference of 0.030%), Serbian ($61,087, a difference of 0.040%), Immigrants from Micronesia ($61,000, a difference of 0.10%), Luxembourger ($60,967, a difference of 0.15%), and Spaniard ($60,866, a difference of 0.32%). Similarly, the demographic groups most similar to Ghanaians are Immigrants from Eritrea ($60,096, a difference of 0.090%), Puget Sound Salish ($59,934, a difference of 0.18%), Immigrants from Thailand ($60,217, a difference of 0.29%), Slovene ($60,241, a difference of 0.33%), and Albanian ($60,249, a difference of 0.34%).
| Demographics | Rating | Rank | Householder Income Over 65 years |
| Serbians | 53.1 /100 | #170 | Average $61,087 |
| Inupiat | 52.4 /100 | #171 | Average $61,061 |
| Immigrants | Poland | 51.9 /100 | #172 | Average $61,041 |
| Immigrants | Micronesia | 50.8 /100 | #173 | Average $61,000 |
| Luxembourgers | 50.0 /100 | #174 | Average $60,967 |
| Spaniards | 47.3 /100 | #175 | Average $60,866 |
| Spanish | 45.5 /100 | #176 | Average $60,795 |
| Alaska Natives | 44.3 /100 | #177 | Average $60,748 |
| Yup'ik | 43.7 /100 | #178 | Average $60,727 |
| Welsh | 42.2 /100 | #179 | Average $60,666 |
| Immigrants | Morocco | 41.7 /100 | #180 | Average $60,647 |
| Celtics | 40.7 /100 | #181 | Average $60,608 |
| Czechoslovakians | 40.0 /100 | #182 | Average $60,581 |
| Kenyans | 38.4 /100 | #183 | Fair $60,514 |
| Iraqis | 37.2 /100 | #184 | Fair $60,466 |
| Albanians | 32.0 /100 | #185 | Fair $60,249 |
| Slovenes | 31.8 /100 | #186 | Fair $60,241 |
| Immigrants | Thailand | 31.3 /100 | #187 | Fair $60,217 |
| Immigrants | Eritrea | 28.6 /100 | #188 | Fair $60,096 |
| Ghanaians | 27.5 /100 | #189 | Fair $60,043 |
| Puget Sound Salish | 25.3 /100 | #190 | Fair $59,934 |