Indonesian vs Immigrants from Taiwan Currently Married
COMPARE
Indonesian
Immigrants from Taiwan
Currently Married
Currently Married Comparison
Indonesians
Immigrants from Taiwan
43.5%
CURRENTLY MARRIED
0.1/ 100
METRIC RATING
272nd/ 347
METRIC RANK
50.7%
CURRENTLY MARRIED
100.0/ 100
METRIC RATING
4th/ 347
METRIC RANK
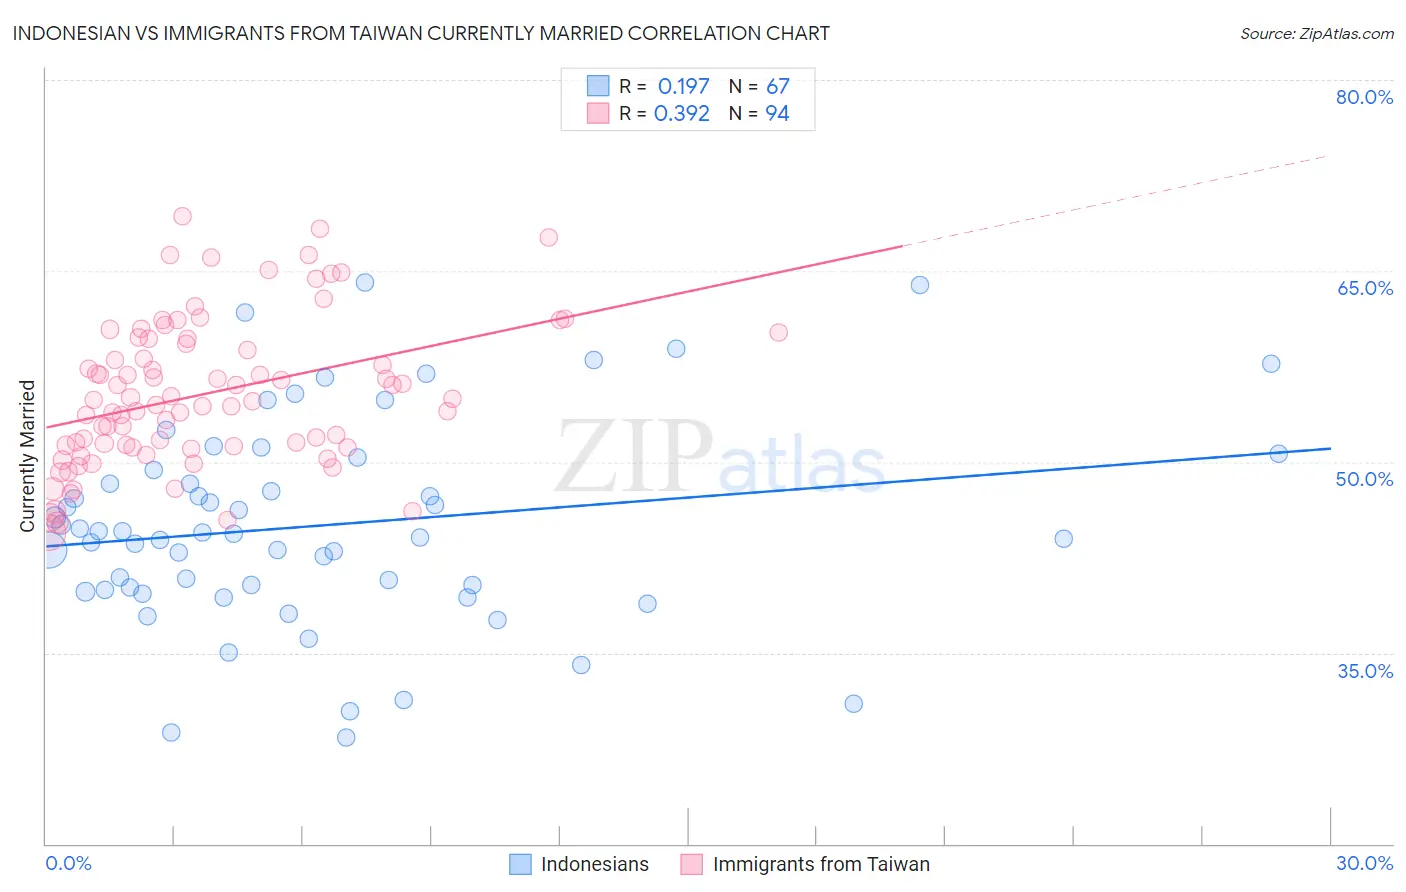
Indonesian vs Immigrants from Taiwan Currently Married Correlation Chart
The statistical analysis conducted on geographies consisting of 162,724,785 people shows a poor positive correlation between the proportion of Indonesians and percentage of population currently married in the United States with a correlation coefficient (R) of 0.197 and weighted average of 43.5%. Similarly, the statistical analysis conducted on geographies consisting of 298,249,316 people shows a mild positive correlation between the proportion of Immigrants from Taiwan and percentage of population currently married in the United States with a correlation coefficient (R) of 0.392 and weighted average of 50.7%, a difference of 16.7%.
Currently Married Correlation Summary
| Measurement | Indonesian | Immigrants from Taiwan |
| Minimum | 28.3% | 44.5% |
| Maximum | 64.1% | 69.2% |
| Range | 35.8% | 24.8% |
| Mean | 45.0% | 55.4% |
| Median | 44.3% | 54.8% |
| Interquartile 25% (IQ1) | 39.9% | 51.2% |
| Interquartile 75% (IQ3) | 49.4% | 59.6% |
| Interquartile Range (IQR) | 9.4% | 8.4% |
| Standard Deviation (Sample) | 8.1% | 5.8% |
| Standard Deviation (Population) | 8.0% | 5.7% |
Similar Demographics by Currently Married
Demographics Similar to Indonesians by Currently Married
In terms of currently married, the demographic groups most similar to Indonesians are Bermudan (43.5%, a difference of 0.040%), Yaqui (43.4%, a difference of 0.040%), Salvadoran (43.5%, a difference of 0.050%), Nigerian (43.4%, a difference of 0.060%), and Colville (43.4%, a difference of 0.080%).
| Demographics | Rating | Rank | Currently Married |
| Immigrants | Bangladesh | 0.1 /100 | #265 | Tragic 43.6% |
| Ecuadorians | 0.1 /100 | #266 | Tragic 43.6% |
| Immigrants | Eritrea | 0.1 /100 | #267 | Tragic 43.6% |
| Spanish American Indians | 0.1 /100 | #268 | Tragic 43.6% |
| Immigrants | Sudan | 0.1 /100 | #269 | Tragic 43.5% |
| Salvadorans | 0.1 /100 | #270 | Tragic 43.5% |
| Bermudans | 0.1 /100 | #271 | Tragic 43.5% |
| Indonesians | 0.1 /100 | #272 | Tragic 43.5% |
| Yaqui | 0.1 /100 | #273 | Tragic 43.4% |
| Nigerians | 0.1 /100 | #274 | Tragic 43.4% |
| Colville | 0.1 /100 | #275 | Tragic 43.4% |
| Sierra Leoneans | 0.1 /100 | #276 | Tragic 43.4% |
| Immigrants | Nigeria | 0.1 /100 | #277 | Tragic 43.4% |
| Central Americans | 0.0 /100 | #278 | Tragic 43.3% |
| Central American Indians | 0.0 /100 | #279 | Tragic 43.3% |
Demographics Similar to Immigrants from Taiwan by Currently Married
In terms of currently married, the demographic groups most similar to Immigrants from Taiwan are Assyrian/Chaldean/Syriac (50.8%, a difference of 0.080%), Thai (50.9%, a difference of 0.26%), Danish (50.5%, a difference of 0.55%), Norwegian (50.2%, a difference of 1.1%), and Immigrants from South Central Asia (50.0%, a difference of 1.4%).
| Demographics | Rating | Rank | Currently Married |
| Immigrants | India | 100.0 /100 | #1 | Exceptional 51.8% |
| Thais | 100.0 /100 | #2 | Exceptional 50.9% |
| Assyrians/Chaldeans/Syriacs | 100.0 /100 | #3 | Exceptional 50.8% |
| Immigrants | Taiwan | 100.0 /100 | #4 | Exceptional 50.7% |
| Danes | 100.0 /100 | #5 | Exceptional 50.5% |
| Norwegians | 100.0 /100 | #6 | Exceptional 50.2% |
| Immigrants | South Central Asia | 100.0 /100 | #7 | Exceptional 50.0% |
| Swedes | 100.0 /100 | #8 | Exceptional 50.0% |
| Czechs | 99.9 /100 | #9 | Exceptional 49.9% |
| Filipinos | 99.9 /100 | #10 | Exceptional 49.7% |
| English | 99.9 /100 | #11 | Exceptional 49.7% |
| Swiss | 99.9 /100 | #12 | Exceptional 49.7% |
| Dutch | 99.9 /100 | #13 | Exceptional 49.6% |
| Germans | 99.9 /100 | #14 | Exceptional 49.6% |
| Pennsylvania Germans | 99.9 /100 | #15 | Exceptional 49.6% |