Arapaho vs Immigrants from Hungary Per Capita Income
COMPARE
Arapaho
Immigrants from Hungary
Per Capita Income
Per Capita Income Comparison
Arapaho
Immigrants from Hungary
$32,345
PER CAPITA INCOME
0.0/ 100
METRIC RATING
338th/ 347
METRIC RANK
$49,303
PER CAPITA INCOME
99.8/ 100
METRIC RATING
72nd/ 347
METRIC RANK
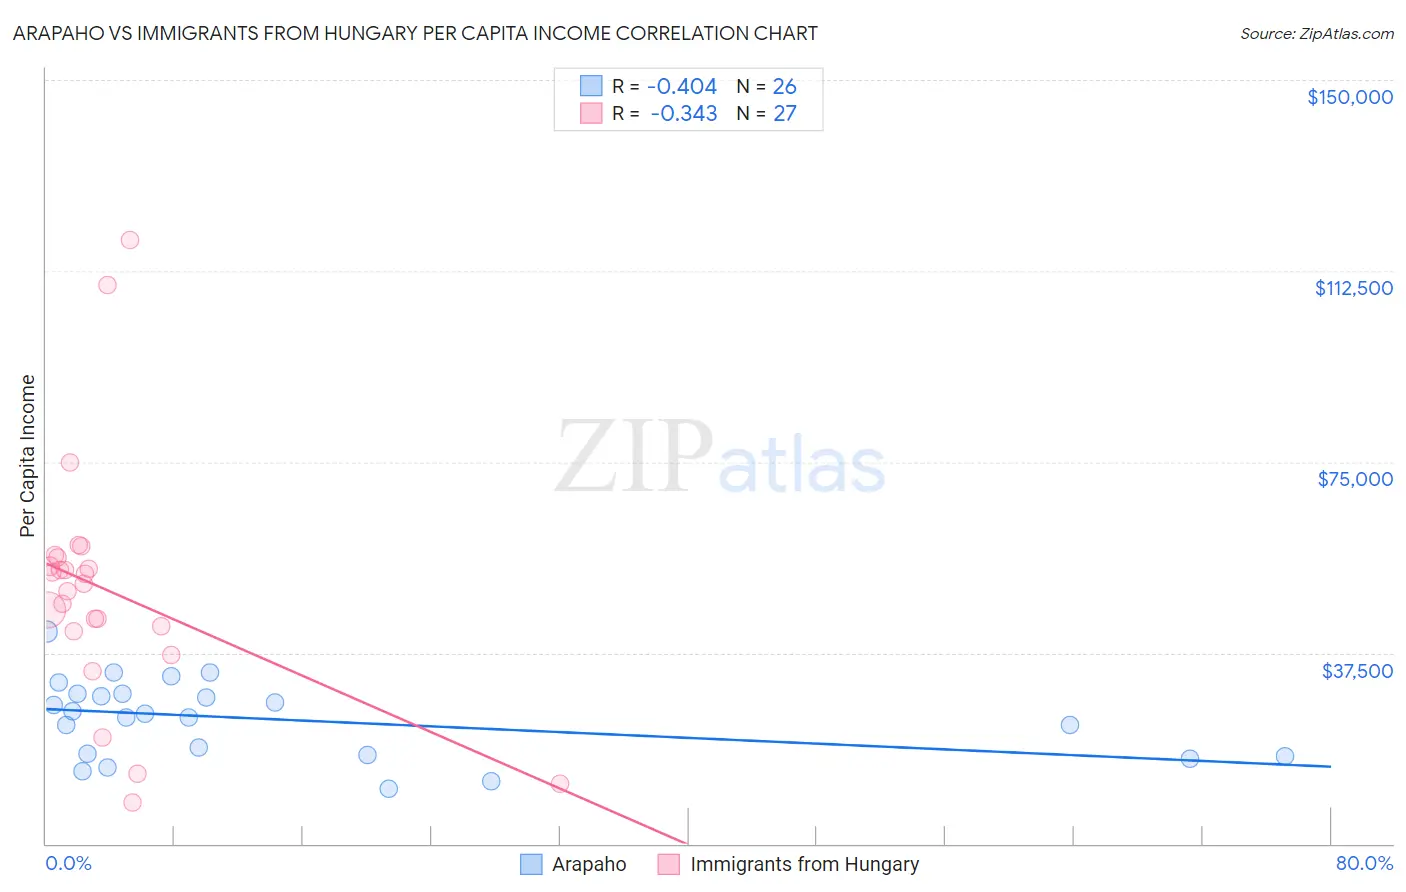
Arapaho vs Immigrants from Hungary Per Capita Income Correlation Chart
The statistical analysis conducted on geographies consisting of 29,780,267 people shows a moderate negative correlation between the proportion of Arapaho and per capita income in the United States with a correlation coefficient (R) of -0.404 and weighted average of $32,345. Similarly, the statistical analysis conducted on geographies consisting of 195,712,632 people shows a mild negative correlation between the proportion of Immigrants from Hungary and per capita income in the United States with a correlation coefficient (R) of -0.343 and weighted average of $49,303, a difference of 52.4%.
Per Capita Income Correlation Summary
| Measurement | Arapaho | Immigrants from Hungary |
| Minimum | $10,798 | $8,083 |
| Maximum | $41,687 | $118,659 |
| Range | $30,889 | $110,576 |
| Mean | $24,378 | $49,900 |
| Median | $25,279 | $51,036 |
| Interquartile 25% (IQ1) | $17,440 | $41,686 |
| Interquartile 75% (IQ3) | $29,495 | $56,245 |
| Interquartile Range (IQR) | $12,055 | $14,559 |
| Standard Deviation (Sample) | $7,667 | $24,211 |
| Standard Deviation (Population) | $7,518 | $23,759 |
Similar Demographics by Per Capita Income
Demographics Similar to Arapaho by Per Capita Income
In terms of per capita income, the demographic groups most similar to Arapaho are Pueblo ($32,012, a difference of 1.0%), Crow ($31,729, a difference of 1.9%), Houma ($32,996, a difference of 2.0%), Yakama ($33,009, a difference of 2.1%), and Yuman ($33,236, a difference of 2.8%).
| Demographics | Rating | Rank | Per Capita Income |
| Immigrants | Mexico | 0.0 /100 | #331 | Tragic $33,931 |
| Sioux | 0.0 /100 | #332 | Tragic $33,921 |
| Immigrants | Yemen | 0.0 /100 | #333 | Tragic $33,696 |
| Natives/Alaskans | 0.0 /100 | #334 | Tragic $33,279 |
| Yuman | 0.0 /100 | #335 | Tragic $33,236 |
| Yakama | 0.0 /100 | #336 | Tragic $33,009 |
| Houma | 0.0 /100 | #337 | Tragic $32,996 |
| Arapaho | 0.0 /100 | #338 | Tragic $32,345 |
| Pueblo | 0.0 /100 | #339 | Tragic $32,012 |
| Crow | 0.0 /100 | #340 | Tragic $31,729 |
| Puerto Ricans | 0.0 /100 | #341 | Tragic $31,268 |
| Hopi | 0.0 /100 | #342 | Tragic $31,177 |
| Pima | 0.0 /100 | #343 | Tragic $30,644 |
| Yup'ik | 0.0 /100 | #344 | Tragic $30,518 |
| Tohono O'odham | 0.0 /100 | #345 | Tragic $30,256 |
Demographics Similar to Immigrants from Hungary by Per Capita Income
In terms of per capita income, the demographic groups most similar to Immigrants from Hungary are Immigrants from North America ($49,302, a difference of 0.0%), Greek ($49,309, a difference of 0.010%), Immigrants from Eastern Europe ($49,316, a difference of 0.030%), Immigrants from Canada ($49,412, a difference of 0.22%), and Mongolian ($49,173, a difference of 0.26%).
| Demographics | Rating | Rank | Per Capita Income |
| Bolivians | 99.9 /100 | #65 | Exceptional $49,526 |
| Immigrants | Bulgaria | 99.9 /100 | #66 | Exceptional $49,482 |
| Immigrants | Romania | 99.9 /100 | #67 | Exceptional $49,463 |
| Lithuanians | 99.8 /100 | #68 | Exceptional $49,448 |
| Immigrants | Canada | 99.8 /100 | #69 | Exceptional $49,412 |
| Immigrants | Eastern Europe | 99.8 /100 | #70 | Exceptional $49,316 |
| Greeks | 99.8 /100 | #71 | Exceptional $49,309 |
| Immigrants | Hungary | 99.8 /100 | #72 | Exceptional $49,303 |
| Immigrants | North America | 99.8 /100 | #73 | Exceptional $49,302 |
| Mongolians | 99.8 /100 | #74 | Exceptional $49,173 |
| Immigrants | Bolivia | 99.7 /100 | #75 | Exceptional $48,970 |
| Immigrants | England | 99.7 /100 | #76 | Exceptional $48,844 |
| Immigrants | Kazakhstan | 99.7 /100 | #77 | Exceptional $48,747 |
| Immigrants | Italy | 99.6 /100 | #78 | Exceptional $48,654 |
| Romanians | 99.5 /100 | #79 | Exceptional $48,445 |