Immigrants vs Eastern European Per Capita Income
COMPARE
Immigrants
Eastern European
Per Capita Income
Per Capita Income Comparison
Immigrants
Eastern Europeans
$43,010
PER CAPITA INCOME
32.5/ 100
METRIC RATING
185th/ 347
METRIC RANK
$55,780
PER CAPITA INCOME
100.0/ 100
METRIC RATING
11th/ 347
METRIC RANK
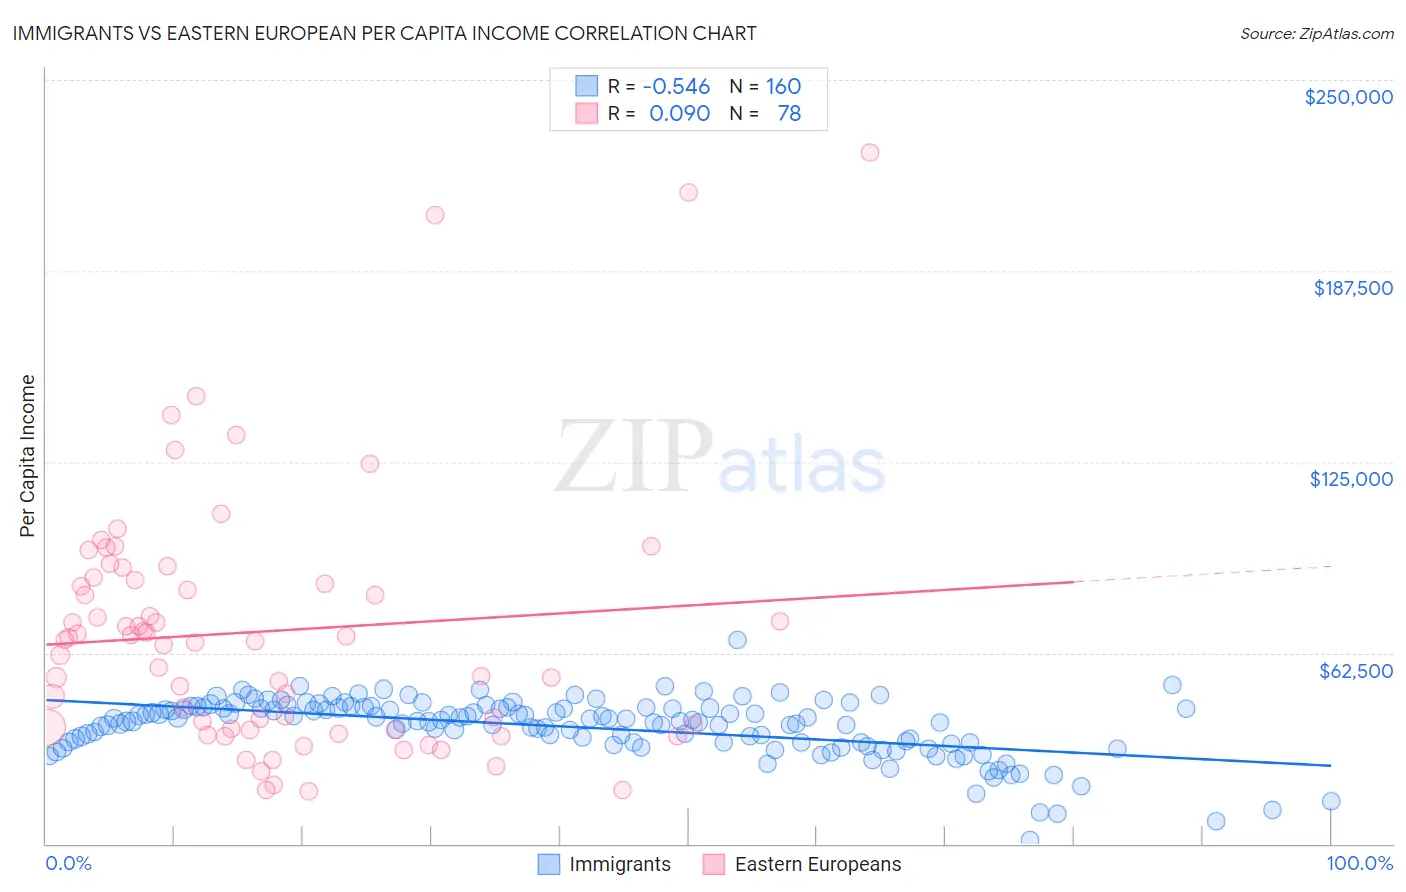
Immigrants vs Eastern European Per Capita Income Correlation Chart
The statistical analysis conducted on geographies consisting of 577,833,144 people shows a substantial negative correlation between the proportion of Immigrants and per capita income in the United States with a correlation coefficient (R) of -0.546 and weighted average of $43,010. Similarly, the statistical analysis conducted on geographies consisting of 461,273,443 people shows a slight positive correlation between the proportion of Eastern Europeans and per capita income in the United States with a correlation coefficient (R) of 0.090 and weighted average of $55,780, a difference of 29.7%.
Per Capita Income Correlation Summary
| Measurement | Immigrants | Eastern European |
| Minimum | $1,397 | $17,105 |
| Maximum | $66,654 | $226,072 |
| Range | $65,257 | $208,967 |
| Mean | $38,278 | $69,550 |
| Median | $40,300 | $66,546 |
| Interquartile 25% (IQ1) | $33,050 | $37,574 |
| Interquartile 75% (IQ3) | $44,506 | $86,383 |
| Interquartile Range (IQR) | $11,456 | $48,809 |
| Standard Deviation (Sample) | $9,625 | $42,028 |
| Standard Deviation (Population) | $9,595 | $41,758 |
Similar Demographics by Per Capita Income
Demographics Similar to Immigrants by Per Capita Income
In terms of per capita income, the demographic groups most similar to Immigrants are French Canadian ($43,003, a difference of 0.020%), Spaniard ($43,028, a difference of 0.040%), Immigrants from Colombia ($42,971, a difference of 0.090%), German ($43,067, a difference of 0.13%), and Immigrants from Africa ($42,950, a difference of 0.14%).
| Demographics | Rating | Rank | Per Capita Income |
| Immigrants | Costa Rica | 44.5 /100 | #178 | Average $43,464 |
| Finns | 44.4 /100 | #179 | Average $43,461 |
| Sierra Leoneans | 42.9 /100 | #180 | Average $43,405 |
| Welsh | 38.2 /100 | #181 | Fair $43,233 |
| Immigrants | Vietnam | 38.1 /100 | #182 | Fair $43,229 |
| Germans | 33.9 /100 | #183 | Fair $43,067 |
| Spaniards | 32.9 /100 | #184 | Fair $43,028 |
| Immigrants | Immigrants | 32.5 /100 | #185 | Fair $43,010 |
| French Canadians | 32.3 /100 | #186 | Fair $43,003 |
| Immigrants | Colombia | 31.5 /100 | #187 | Fair $42,971 |
| Immigrants | Africa | 31.0 /100 | #188 | Fair $42,950 |
| Bermudans | 30.1 /100 | #189 | Fair $42,911 |
| Kenyans | 27.7 /100 | #190 | Fair $42,808 |
| Yugoslavians | 27.4 /100 | #191 | Fair $42,792 |
| Iraqis | 26.7 /100 | #192 | Fair $42,760 |
Demographics Similar to Eastern Europeans by Per Capita Income
In terms of per capita income, the demographic groups most similar to Eastern Europeans are Okinawan ($55,817, a difference of 0.070%), Immigrants from Sweden ($55,582, a difference of 0.36%), Immigrants from India ($55,268, a difference of 0.93%), Immigrants from Belgium ($55,082, a difference of 1.3%), and Immigrants from Ireland ($56,584, a difference of 1.4%).
| Demographics | Rating | Rank | Per Capita Income |
| Immigrants | Australia | 100.0 /100 | #4 | Exceptional $57,953 |
| Immigrants | Iran | 100.0 /100 | #5 | Exceptional $57,759 |
| Immigrants | Taiwan | 100.0 /100 | #6 | Exceptional $57,742 |
| Immigrants | Israel | 100.0 /100 | #7 | Exceptional $57,384 |
| Immigrants | Hong Kong | 100.0 /100 | #8 | Exceptional $56,709 |
| Immigrants | Ireland | 100.0 /100 | #9 | Exceptional $56,584 |
| Okinawans | 100.0 /100 | #10 | Exceptional $55,817 |
| Eastern Europeans | 100.0 /100 | #11 | Exceptional $55,780 |
| Immigrants | Sweden | 100.0 /100 | #12 | Exceptional $55,582 |
| Immigrants | India | 100.0 /100 | #13 | Exceptional $55,268 |
| Immigrants | Belgium | 100.0 /100 | #14 | Exceptional $55,082 |
| Cypriots | 100.0 /100 | #15 | Exceptional $54,899 |
| Immigrants | Switzerland | 100.0 /100 | #16 | Exceptional $54,866 |
| Immigrants | France | 100.0 /100 | #17 | Exceptional $54,557 |
| Thais | 100.0 /100 | #18 | Exceptional $54,307 |