Norwegian vs Immigrants from Hungary Per Capita Income
COMPARE
Norwegian
Immigrants from Hungary
Per Capita Income
Per Capita Income Comparison
Norwegians
Immigrants from Hungary
$44,480
PER CAPITA INCOME
71.5/ 100
METRIC RATING
151st/ 347
METRIC RANK
$49,303
PER CAPITA INCOME
99.8/ 100
METRIC RATING
72nd/ 347
METRIC RANK
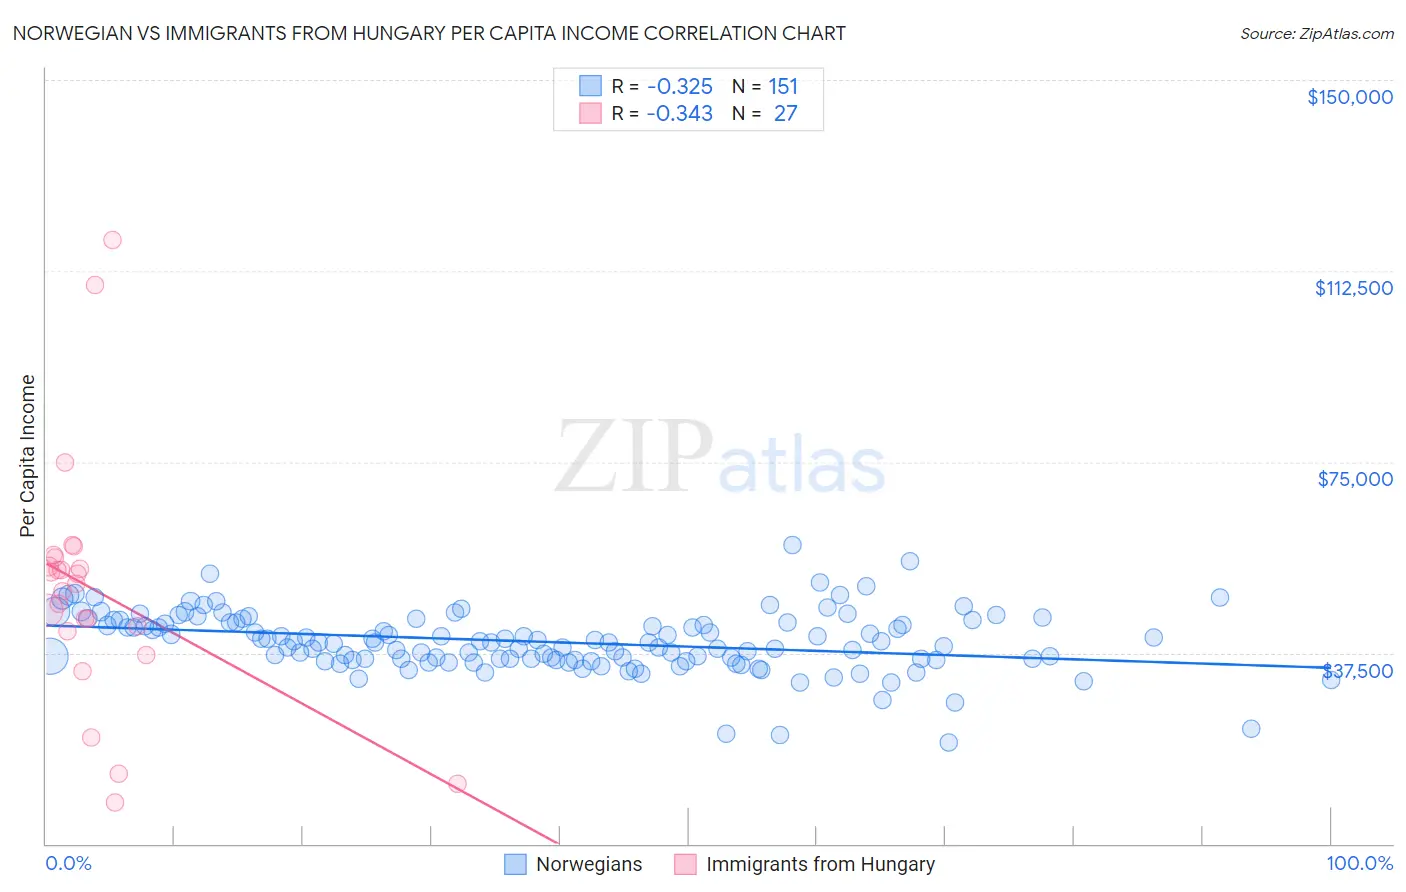
Norwegian vs Immigrants from Hungary Per Capita Income Correlation Chart
The statistical analysis conducted on geographies consisting of 533,432,025 people shows a mild negative correlation between the proportion of Norwegians and per capita income in the United States with a correlation coefficient (R) of -0.325 and weighted average of $44,480. Similarly, the statistical analysis conducted on geographies consisting of 195,712,632 people shows a mild negative correlation between the proportion of Immigrants from Hungary and per capita income in the United States with a correlation coefficient (R) of -0.343 and weighted average of $49,303, a difference of 10.8%.
Per Capita Income Correlation Summary
| Measurement | Norwegian | Immigrants from Hungary |
| Minimum | $19,862 | $8,083 |
| Maximum | $58,625 | $118,659 |
| Range | $38,763 | $110,576 |
| Mean | $39,667 | $49,900 |
| Median | $39,585 | $51,036 |
| Interquartile 25% (IQ1) | $36,106 | $41,686 |
| Interquartile 75% (IQ3) | $43,454 | $56,245 |
| Interquartile Range (IQR) | $7,348 | $14,559 |
| Standard Deviation (Sample) | $5,967 | $24,211 |
| Standard Deviation (Population) | $5,947 | $23,759 |
Similar Demographics by Per Capita Income
Demographics Similar to Norwegians by Per Capita Income
In terms of per capita income, the demographic groups most similar to Norwegians are Peruvian ($44,479, a difference of 0.0%), Immigrants from Eritrea ($44,509, a difference of 0.060%), Scottish ($44,440, a difference of 0.090%), Korean ($44,522, a difference of 0.10%), and Immigrants from Armenia ($44,552, a difference of 0.16%).
| Demographics | Rating | Rank | Per Capita Income |
| Icelanders | 81.6 /100 | #144 | Excellent $44,987 |
| Immigrants | Afghanistan | 78.0 /100 | #145 | Good $44,790 |
| Irish | 75.8 /100 | #146 | Good $44,679 |
| Czechs | 74.1 /100 | #147 | Good $44,595 |
| Immigrants | Armenia | 73.1 /100 | #148 | Good $44,552 |
| Koreans | 72.5 /100 | #149 | Good $44,522 |
| Immigrants | Eritrea | 72.1 /100 | #150 | Good $44,509 |
| Norwegians | 71.5 /100 | #151 | Good $44,480 |
| Peruvians | 71.5 /100 | #152 | Good $44,479 |
| Scottish | 70.6 /100 | #153 | Good $44,440 |
| Portuguese | 68.7 /100 | #154 | Good $44,362 |
| Uruguayans | 67.6 /100 | #155 | Good $44,318 |
| Slovaks | 65.4 /100 | #156 | Good $44,229 |
| South American Indians | 64.8 /100 | #157 | Good $44,206 |
| Immigrants | Nepal | 64.3 /100 | #158 | Good $44,187 |
Demographics Similar to Immigrants from Hungary by Per Capita Income
In terms of per capita income, the demographic groups most similar to Immigrants from Hungary are Immigrants from North America ($49,302, a difference of 0.0%), Greek ($49,309, a difference of 0.010%), Immigrants from Eastern Europe ($49,316, a difference of 0.030%), Immigrants from Canada ($49,412, a difference of 0.22%), and Mongolian ($49,173, a difference of 0.26%).
| Demographics | Rating | Rank | Per Capita Income |
| Bolivians | 99.9 /100 | #65 | Exceptional $49,526 |
| Immigrants | Bulgaria | 99.9 /100 | #66 | Exceptional $49,482 |
| Immigrants | Romania | 99.9 /100 | #67 | Exceptional $49,463 |
| Lithuanians | 99.8 /100 | #68 | Exceptional $49,448 |
| Immigrants | Canada | 99.8 /100 | #69 | Exceptional $49,412 |
| Immigrants | Eastern Europe | 99.8 /100 | #70 | Exceptional $49,316 |
| Greeks | 99.8 /100 | #71 | Exceptional $49,309 |
| Immigrants | Hungary | 99.8 /100 | #72 | Exceptional $49,303 |
| Immigrants | North America | 99.8 /100 | #73 | Exceptional $49,302 |
| Mongolians | 99.8 /100 | #74 | Exceptional $49,173 |
| Immigrants | Bolivia | 99.7 /100 | #75 | Exceptional $48,970 |
| Immigrants | England | 99.7 /100 | #76 | Exceptional $48,844 |
| Immigrants | Kazakhstan | 99.7 /100 | #77 | Exceptional $48,747 |
| Immigrants | Italy | 99.6 /100 | #78 | Exceptional $48,654 |
| Romanians | 99.5 /100 | #79 | Exceptional $48,445 |