Immigrants vs Cherokee Per Capita Income
COMPARE
Immigrants
Cherokee
Per Capita Income
Per Capita Income Comparison
Immigrants
Cherokee
$43,010
PER CAPITA INCOME
32.5/ 100
METRIC RATING
185th/ 347
METRIC RANK
$37,203
PER CAPITA INCOME
0.1/ 100
METRIC RATING
299th/ 347
METRIC RANK
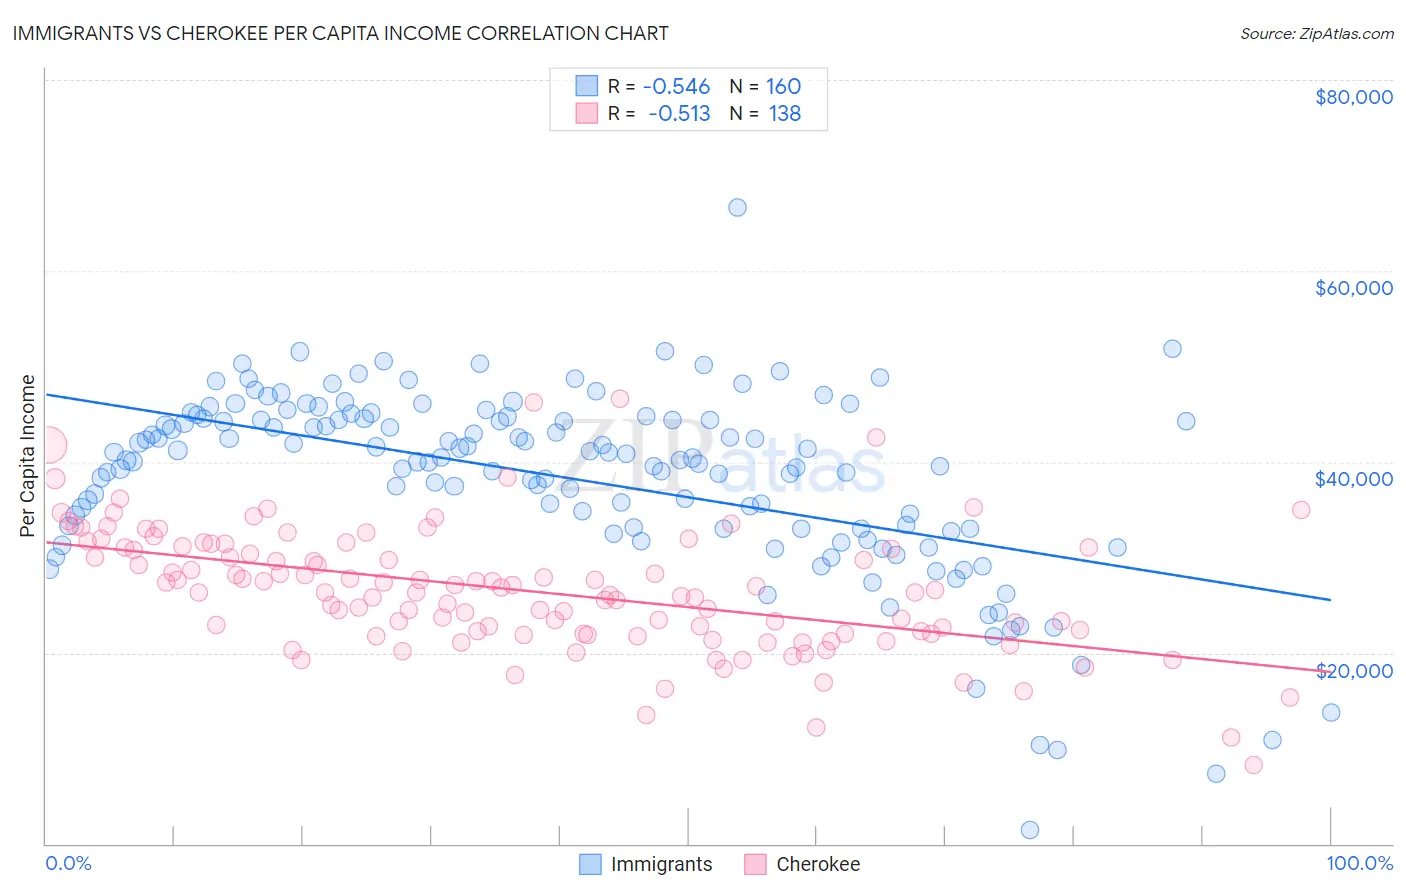
Immigrants vs Cherokee Per Capita Income Correlation Chart
The statistical analysis conducted on geographies consisting of 577,833,144 people shows a substantial negative correlation between the proportion of Immigrants and per capita income in the United States with a correlation coefficient (R) of -0.546 and weighted average of $43,010. Similarly, the statistical analysis conducted on geographies consisting of 493,739,592 people shows a substantial negative correlation between the proportion of Cherokee and per capita income in the United States with a correlation coefficient (R) of -0.513 and weighted average of $37,203, a difference of 15.6%.
Per Capita Income Correlation Summary
| Measurement | Immigrants | Cherokee |
| Minimum | $1,397 | $8,186 |
| Maximum | $66,654 | $46,594 |
| Range | $65,257 | $38,408 |
| Mean | $38,278 | $26,478 |
| Median | $40,300 | $26,343 |
| Interquartile 25% (IQ1) | $33,050 | $21,995 |
| Interquartile 75% (IQ3) | $44,506 | $30,981 |
| Interquartile Range (IQR) | $11,456 | $8,986 |
| Standard Deviation (Sample) | $9,625 | $6,463 |
| Standard Deviation (Population) | $9,595 | $6,439 |
Similar Demographics by Per Capita Income
Demographics Similar to Immigrants by Per Capita Income
In terms of per capita income, the demographic groups most similar to Immigrants are French Canadian ($43,003, a difference of 0.020%), Spaniard ($43,028, a difference of 0.040%), Immigrants from Colombia ($42,971, a difference of 0.090%), German ($43,067, a difference of 0.13%), and Immigrants from Africa ($42,950, a difference of 0.14%).
| Demographics | Rating | Rank | Per Capita Income |
| Immigrants | Costa Rica | 44.5 /100 | #178 | Average $43,464 |
| Finns | 44.4 /100 | #179 | Average $43,461 |
| Sierra Leoneans | 42.9 /100 | #180 | Average $43,405 |
| Welsh | 38.2 /100 | #181 | Fair $43,233 |
| Immigrants | Vietnam | 38.1 /100 | #182 | Fair $43,229 |
| Germans | 33.9 /100 | #183 | Fair $43,067 |
| Spaniards | 32.9 /100 | #184 | Fair $43,028 |
| Immigrants | Immigrants | 32.5 /100 | #185 | Fair $43,010 |
| French Canadians | 32.3 /100 | #186 | Fair $43,003 |
| Immigrants | Colombia | 31.5 /100 | #187 | Fair $42,971 |
| Immigrants | Africa | 31.0 /100 | #188 | Fair $42,950 |
| Bermudans | 30.1 /100 | #189 | Fair $42,911 |
| Kenyans | 27.7 /100 | #190 | Fair $42,808 |
| Yugoslavians | 27.4 /100 | #191 | Fair $42,792 |
| Iraqis | 26.7 /100 | #192 | Fair $42,760 |
Demographics Similar to Cherokee by Per Capita Income
In terms of per capita income, the demographic groups most similar to Cherokee are Immigrants from Bahamas ($37,193, a difference of 0.030%), Immigrants from Caribbean ($37,254, a difference of 0.14%), Haitian ($37,289, a difference of 0.23%), Indonesian ($37,300, a difference of 0.26%), and Immigrants from Dominican Republic ($37,306, a difference of 0.27%).
| Demographics | Rating | Rank | Per Capita Income |
| Immigrants | Micronesia | 0.1 /100 | #292 | Tragic $37,464 |
| Mexican American Indians | 0.1 /100 | #293 | Tragic $37,407 |
| Cubans | 0.1 /100 | #294 | Tragic $37,383 |
| Immigrants | Dominican Republic | 0.1 /100 | #295 | Tragic $37,306 |
| Indonesians | 0.1 /100 | #296 | Tragic $37,300 |
| Haitians | 0.1 /100 | #297 | Tragic $37,289 |
| Immigrants | Caribbean | 0.1 /100 | #298 | Tragic $37,254 |
| Cherokee | 0.1 /100 | #299 | Tragic $37,203 |
| Immigrants | Bahamas | 0.1 /100 | #300 | Tragic $37,193 |
| Ottawa | 0.1 /100 | #301 | Tragic $37,101 |
| Shoshone | 0.1 /100 | #302 | Tragic $37,072 |
| Paiute | 0.1 /100 | #303 | Tragic $37,066 |
| Hondurans | 0.1 /100 | #304 | Tragic $37,031 |
| Inupiat | 0.1 /100 | #305 | Tragic $36,999 |
| Immigrants | Haiti | 0.0 /100 | #306 | Tragic $36,849 |