Immigrants from Western Asia vs Swedish Median Household Income
COMPARE
Immigrants from Western Asia
Swedish
Median Household Income
Median Household Income Comparison
Immigrants from Western Asia
Swedes
$90,005
MEDIAN HOUSEHOLD INCOME
95.9/ 100
METRIC RATING
115th/ 347
METRIC RANK
$88,524
MEDIAN HOUSEHOLD INCOME
90.0/ 100
METRIC RATING
134th/ 347
METRIC RANK
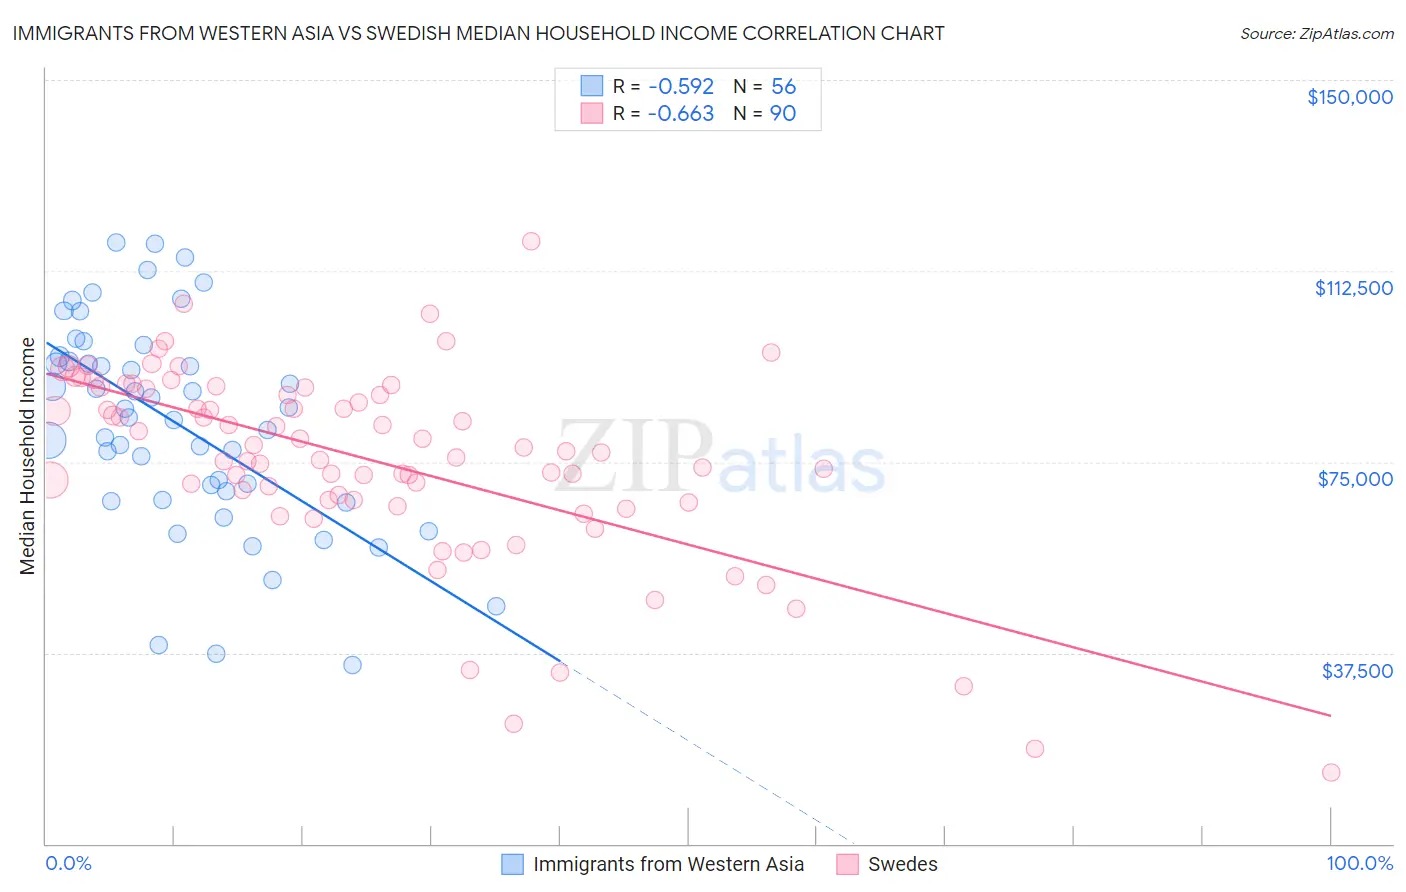
Immigrants from Western Asia vs Swedish Median Household Income Correlation Chart
The statistical analysis conducted on geographies consisting of 404,096,096 people shows a substantial negative correlation between the proportion of Immigrants from Western Asia and median household income in the United States with a correlation coefficient (R) of -0.592 and weighted average of $90,005. Similarly, the statistical analysis conducted on geographies consisting of 538,472,836 people shows a significant negative correlation between the proportion of Swedes and median household income in the United States with a correlation coefficient (R) of -0.663 and weighted average of $88,524, a difference of 1.7%.
Median Household Income Correlation Summary
| Measurement | Immigrants from Western Asia | Swedish |
| Minimum | $35,078 | $14,107 |
| Maximum | $118,185 | $118,333 |
| Range | $83,107 | $104,226 |
| Mean | $82,428 | $75,217 |
| Median | $84,634 | $76,969 |
| Interquartile 25% (IQ1) | $68,360 | $67,408 |
| Interquartile 75% (IQ3) | $95,239 | $89,464 |
| Interquartile Range (IQR) | $26,880 | $22,056 |
| Standard Deviation (Sample) | $20,407 | $18,981 |
| Standard Deviation (Population) | $20,224 | $18,875 |
Demographics Similar to Immigrants from Western Asia and Swedes by Median Household Income
In terms of median household income, the demographic groups most similar to Immigrants from Western Asia are Immigrants from Northern Africa ($90,026, a difference of 0.020%), Native Hawaiian ($89,919, a difference of 0.10%), Taiwanese ($89,900, a difference of 0.12%), Syrian ($89,830, a difference of 0.19%), and Albanian ($89,744, a difference of 0.29%). Similarly, the demographic groups most similar to Swedes are Immigrants from Ethiopia ($88,687, a difference of 0.18%), European ($88,751, a difference of 0.26%), Immigrants from Syria ($88,792, a difference of 0.30%), British ($88,914, a difference of 0.44%), and Brazilian ($88,934, a difference of 0.46%).
| Demographics | Rating | Rank | Median Household Income |
| Immigrants | Northern Africa | 95.9 /100 | #114 | Exceptional $90,026 |
| Immigrants | Western Asia | 95.9 /100 | #115 | Exceptional $90,005 |
| Native Hawaiians | 95.7 /100 | #116 | Exceptional $89,919 |
| Taiwanese | 95.6 /100 | #117 | Exceptional $89,900 |
| Syrians | 95.4 /100 | #118 | Exceptional $89,830 |
| Albanians | 95.2 /100 | #119 | Exceptional $89,744 |
| Immigrants | North Macedonia | 95.2 /100 | #120 | Exceptional $89,741 |
| Ethiopians | 94.9 /100 | #121 | Exceptional $89,640 |
| Pakistanis | 94.8 /100 | #122 | Exceptional $89,638 |
| Immigrants | Zimbabwe | 94.4 /100 | #123 | Exceptional $89,496 |
| Immigrants | Jordan | 94.1 /100 | #124 | Exceptional $89,412 |
| Immigrants | Kuwait | 93.5 /100 | #125 | Exceptional $89,263 |
| Immigrants | Oceania | 92.9 /100 | #126 | Exceptional $89,100 |
| Immigrants | Peru | 92.5 /100 | #127 | Exceptional $89,010 |
| Portuguese | 92.3 /100 | #128 | Exceptional $88,976 |
| Brazilians | 92.1 /100 | #129 | Exceptional $88,934 |
| British | 92.0 /100 | #130 | Exceptional $88,914 |
| Immigrants | Syria | 91.4 /100 | #131 | Exceptional $88,792 |
| Europeans | 91.2 /100 | #132 | Exceptional $88,751 |
| Immigrants | Ethiopia | 90.9 /100 | #133 | Exceptional $88,687 |
| Swedes | 90.0 /100 | #134 | Exceptional $88,524 |