Immigrants from Western Asia vs Nicaraguan Median Household Income
COMPARE
Immigrants from Western Asia
Nicaraguan
Median Household Income
Median Household Income Comparison
Immigrants from Western Asia
Nicaraguans
$90,005
MEDIAN HOUSEHOLD INCOME
95.9/ 100
METRIC RATING
115th/ 347
METRIC RANK
$79,737
MEDIAN HOUSEHOLD INCOME
3.1/ 100
METRIC RATING
237th/ 347
METRIC RANK
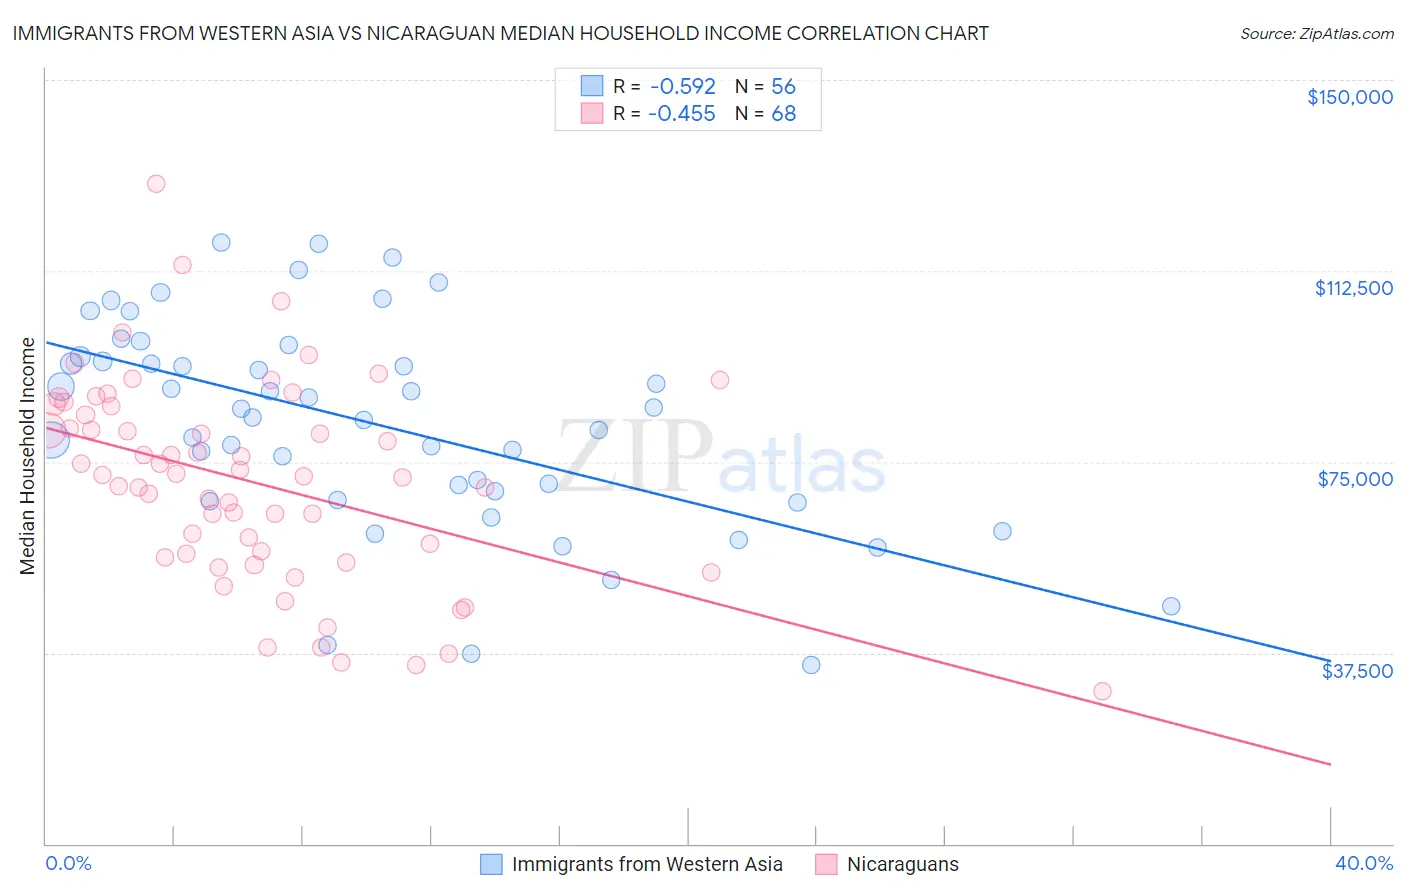
Immigrants from Western Asia vs Nicaraguan Median Household Income Correlation Chart
The statistical analysis conducted on geographies consisting of 404,096,096 people shows a substantial negative correlation between the proportion of Immigrants from Western Asia and median household income in the United States with a correlation coefficient (R) of -0.592 and weighted average of $90,005. Similarly, the statistical analysis conducted on geographies consisting of 285,567,751 people shows a moderate negative correlation between the proportion of Nicaraguans and median household income in the United States with a correlation coefficient (R) of -0.455 and weighted average of $79,737, a difference of 12.9%.
Median Household Income Correlation Summary
| Measurement | Immigrants from Western Asia | Nicaraguan |
| Minimum | $35,078 | $29,878 |
| Maximum | $118,185 | $129,595 |
| Range | $83,107 | $99,717 |
| Mean | $82,428 | $70,971 |
| Median | $84,634 | $72,218 |
| Interquartile 25% (IQ1) | $68,360 | $56,639 |
| Interquartile 75% (IQ3) | $95,239 | $85,047 |
| Interquartile Range (IQR) | $26,880 | $28,408 |
| Standard Deviation (Sample) | $20,407 | $19,770 |
| Standard Deviation (Population) | $20,224 | $19,624 |
Similar Demographics by Median Household Income
Demographics Similar to Immigrants from Western Asia by Median Household Income
In terms of median household income, the demographic groups most similar to Immigrants from Western Asia are Immigrants from Northern Africa ($90,026, a difference of 0.020%), Native Hawaiian ($89,919, a difference of 0.10%), Taiwanese ($89,900, a difference of 0.12%), Syrian ($89,830, a difference of 0.19%), and Peruvian ($90,261, a difference of 0.28%).
| Demographics | Rating | Rank | Median Household Income |
| Zimbabweans | 97.2 /100 | #108 | Exceptional $90,618 |
| Chileans | 97.2 /100 | #109 | Exceptional $90,605 |
| Palestinians | 97.1 /100 | #110 | Exceptional $90,574 |
| Immigrants | Poland | 97.1 /100 | #111 | Exceptional $90,549 |
| Northern Europeans | 96.9 /100 | #112 | Exceptional $90,446 |
| Peruvians | 96.5 /100 | #113 | Exceptional $90,261 |
| Immigrants | Northern Africa | 95.9 /100 | #114 | Exceptional $90,026 |
| Immigrants | Western Asia | 95.9 /100 | #115 | Exceptional $90,005 |
| Native Hawaiians | 95.7 /100 | #116 | Exceptional $89,919 |
| Taiwanese | 95.6 /100 | #117 | Exceptional $89,900 |
| Syrians | 95.4 /100 | #118 | Exceptional $89,830 |
| Albanians | 95.2 /100 | #119 | Exceptional $89,744 |
| Immigrants | North Macedonia | 95.2 /100 | #120 | Exceptional $89,741 |
| Ethiopians | 94.9 /100 | #121 | Exceptional $89,640 |
| Pakistanis | 94.8 /100 | #122 | Exceptional $89,638 |
Demographics Similar to Nicaraguans by Median Household Income
In terms of median household income, the demographic groups most similar to Nicaraguans are Barbadian ($79,664, a difference of 0.090%), Immigrants from Bosnia and Herzegovina ($79,888, a difference of 0.19%), Alaska Native ($79,509, a difference of 0.29%), Immigrants from Western Africa ($79,490, a difference of 0.31%), and Nonimmigrants ($79,429, a difference of 0.39%).
| Demographics | Rating | Rank | Median Household Income |
| Bermudans | 4.7 /100 | #230 | Tragic $80,406 |
| Trinidadians and Tobagonians | 4.7 /100 | #231 | Tragic $80,402 |
| Immigrants | Trinidad and Tobago | 4.6 /100 | #232 | Tragic $80,373 |
| Immigrants | Azores | 4.5 /100 | #233 | Tragic $80,357 |
| Immigrants | Ecuador | 4.5 /100 | #234 | Tragic $80,341 |
| Immigrants | Guyana | 4.5 /100 | #235 | Tragic $80,324 |
| Immigrants | Bosnia and Herzegovina | 3.4 /100 | #236 | Tragic $79,888 |
| Nicaraguans | 3.1 /100 | #237 | Tragic $79,737 |
| Barbadians | 3.0 /100 | #238 | Tragic $79,664 |
| Alaska Natives | 2.7 /100 | #239 | Tragic $79,509 |
| Immigrants | Western Africa | 2.7 /100 | #240 | Tragic $79,490 |
| Immigrants | Nonimmigrants | 2.6 /100 | #241 | Tragic $79,429 |
| Immigrants | Sudan | 2.1 /100 | #242 | Tragic $79,103 |
| Immigrants | Barbados | 1.9 /100 | #243 | Tragic $78,989 |
| Marshallese | 1.9 /100 | #244 | Tragic $78,930 |