Immigrants from Western Asia vs Brazilian Median Household Income
COMPARE
Immigrants from Western Asia
Brazilian
Median Household Income
Median Household Income Comparison
Immigrants from Western Asia
Brazilians
$90,005
MEDIAN HOUSEHOLD INCOME
95.9/ 100
METRIC RATING
115th/ 347
METRIC RANK
$88,934
MEDIAN HOUSEHOLD INCOME
92.1/ 100
METRIC RATING
129th/ 347
METRIC RANK
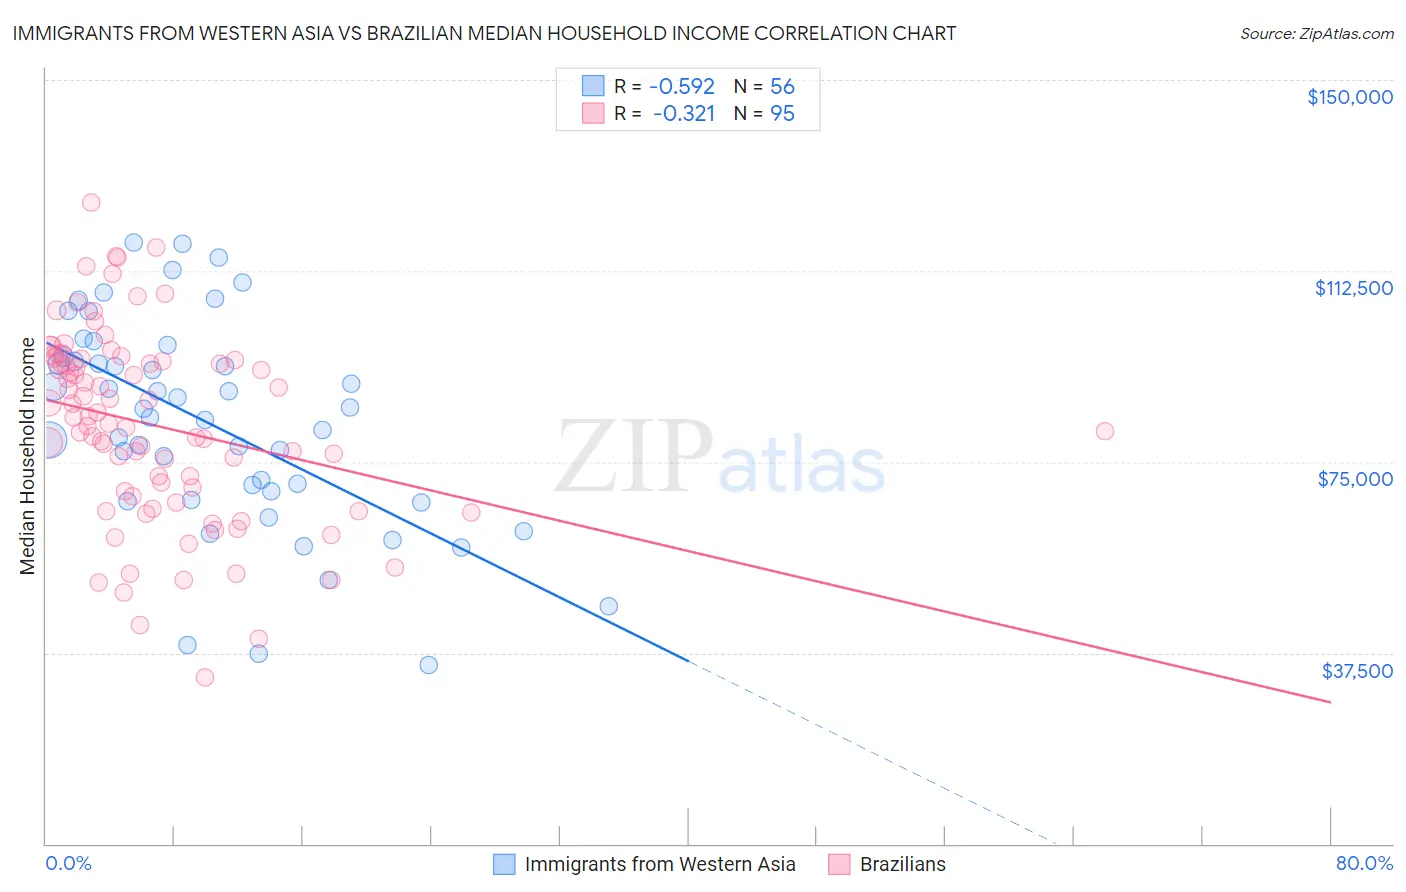
Immigrants from Western Asia vs Brazilian Median Household Income Correlation Chart
The statistical analysis conducted on geographies consisting of 404,096,096 people shows a substantial negative correlation between the proportion of Immigrants from Western Asia and median household income in the United States with a correlation coefficient (R) of -0.592 and weighted average of $90,005. Similarly, the statistical analysis conducted on geographies consisting of 323,646,187 people shows a mild negative correlation between the proportion of Brazilians and median household income in the United States with a correlation coefficient (R) of -0.321 and weighted average of $88,934, a difference of 1.2%.
Median Household Income Correlation Summary
| Measurement | Immigrants from Western Asia | Brazilian |
| Minimum | $35,078 | $32,591 |
| Maximum | $118,185 | $126,001 |
| Range | $83,107 | $93,410 |
| Mean | $82,428 | $82,158 |
| Median | $84,634 | $83,690 |
| Interquartile 25% (IQ1) | $68,360 | $68,333 |
| Interquartile 75% (IQ3) | $95,239 | $94,909 |
| Interquartile Range (IQR) | $26,880 | $26,576 |
| Standard Deviation (Sample) | $20,407 | $18,705 |
| Standard Deviation (Population) | $20,224 | $18,606 |
Demographics Similar to Immigrants from Western Asia and Brazilians by Median Household Income
In terms of median household income, the demographic groups most similar to Immigrants from Western Asia are Immigrants from Northern Africa ($90,026, a difference of 0.020%), Native Hawaiian ($89,919, a difference of 0.10%), Taiwanese ($89,900, a difference of 0.12%), Syrian ($89,830, a difference of 0.19%), and Peruvian ($90,261, a difference of 0.28%). Similarly, the demographic groups most similar to Brazilians are British ($88,914, a difference of 0.020%), Portuguese ($88,976, a difference of 0.050%), Immigrants from Peru ($89,010, a difference of 0.090%), Immigrants from Syria ($88,792, a difference of 0.16%), and Immigrants from Oceania ($89,100, a difference of 0.19%).
| Demographics | Rating | Rank | Median Household Income |
| Northern Europeans | 96.9 /100 | #112 | Exceptional $90,446 |
| Peruvians | 96.5 /100 | #113 | Exceptional $90,261 |
| Immigrants | Northern Africa | 95.9 /100 | #114 | Exceptional $90,026 |
| Immigrants | Western Asia | 95.9 /100 | #115 | Exceptional $90,005 |
| Native Hawaiians | 95.7 /100 | #116 | Exceptional $89,919 |
| Taiwanese | 95.6 /100 | #117 | Exceptional $89,900 |
| Syrians | 95.4 /100 | #118 | Exceptional $89,830 |
| Albanians | 95.2 /100 | #119 | Exceptional $89,744 |
| Immigrants | North Macedonia | 95.2 /100 | #120 | Exceptional $89,741 |
| Ethiopians | 94.9 /100 | #121 | Exceptional $89,640 |
| Pakistanis | 94.8 /100 | #122 | Exceptional $89,638 |
| Immigrants | Zimbabwe | 94.4 /100 | #123 | Exceptional $89,496 |
| Immigrants | Jordan | 94.1 /100 | #124 | Exceptional $89,412 |
| Immigrants | Kuwait | 93.5 /100 | #125 | Exceptional $89,263 |
| Immigrants | Oceania | 92.9 /100 | #126 | Exceptional $89,100 |
| Immigrants | Peru | 92.5 /100 | #127 | Exceptional $89,010 |
| Portuguese | 92.3 /100 | #128 | Exceptional $88,976 |
| Brazilians | 92.1 /100 | #129 | Exceptional $88,934 |
| British | 92.0 /100 | #130 | Exceptional $88,914 |
| Immigrants | Syria | 91.4 /100 | #131 | Exceptional $88,792 |
| Europeans | 91.2 /100 | #132 | Exceptional $88,751 |