Immigrants from Cambodia vs Brazilian Median Earnings
COMPARE
Immigrants from Cambodia
Brazilian
Median Earnings
Median Earnings Comparison
Immigrants from Cambodia
Brazilians
$45,090
MEDIAN EARNINGS
13.2/ 100
METRIC RATING
225th/ 347
METRIC RANK
$48,356
MEDIAN EARNINGS
93.7/ 100
METRIC RATING
124th/ 347
METRIC RANK
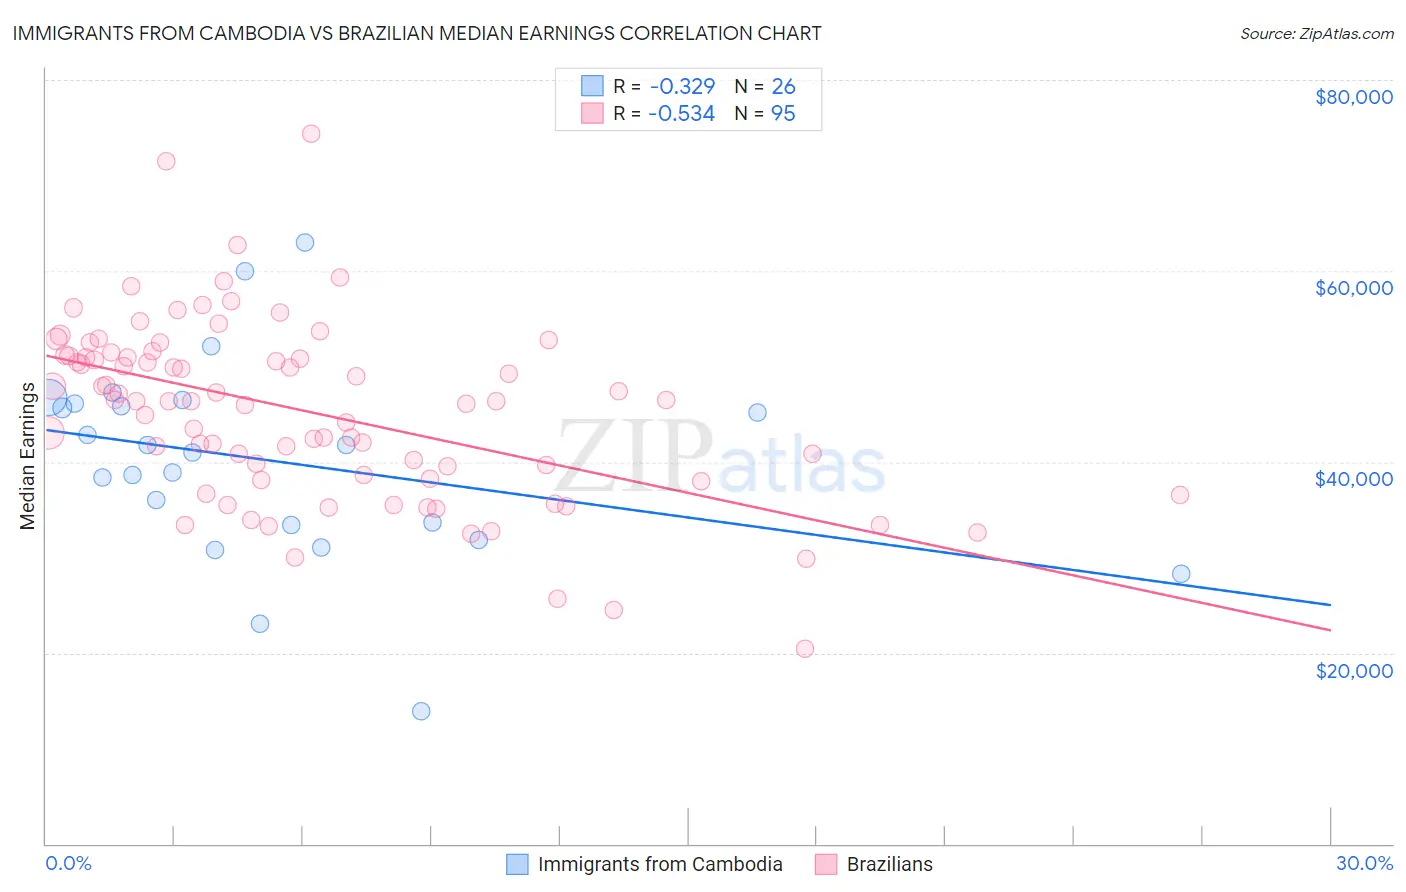
Immigrants from Cambodia vs Brazilian Median Earnings Correlation Chart
The statistical analysis conducted on geographies consisting of 205,155,765 people shows a mild negative correlation between the proportion of Immigrants from Cambodia and median earnings in the United States with a correlation coefficient (R) of -0.329 and weighted average of $45,090. Similarly, the statistical analysis conducted on geographies consisting of 323,957,574 people shows a substantial negative correlation between the proportion of Brazilians and median earnings in the United States with a correlation coefficient (R) of -0.534 and weighted average of $48,356, a difference of 7.2%.
Median Earnings Correlation Summary
| Measurement | Immigrants from Cambodia | Brazilian |
| Minimum | $13,852 | $20,417 |
| Maximum | $62,969 | $74,375 |
| Range | $49,117 | $53,958 |
| Mean | $40,126 | $45,246 |
| Median | $41,377 | $46,406 |
| Interquartile 25% (IQ1) | $33,437 | $38,216 |
| Interquartile 75% (IQ3) | $46,102 | $51,116 |
| Interquartile Range (IQR) | $12,665 | $12,900 |
| Standard Deviation (Sample) | $10,590 | $9,424 |
| Standard Deviation (Population) | $10,384 | $9,375 |
Similar Demographics by Median Earnings
Demographics Similar to Immigrants from Cambodia by Median Earnings
In terms of median earnings, the demographic groups most similar to Immigrants from Cambodia are West Indian ($45,132, a difference of 0.090%), Immigrants from Nigeria ($45,030, a difference of 0.13%), Native Hawaiian ($45,027, a difference of 0.14%), Immigrants from Iraq ($44,988, a difference of 0.22%), and Immigrants from Panama ($45,198, a difference of 0.24%).
| Demographics | Rating | Rank | Median Earnings |
| Spanish | 19.7 /100 | #218 | Poor $45,432 |
| Dutch | 18.4 /100 | #219 | Poor $45,370 |
| Ecuadorians | 15.3 /100 | #220 | Poor $45,214 |
| Immigrants | Guyana | 15.1 /100 | #221 | Poor $45,204 |
| Immigrants | Panama | 15.0 /100 | #222 | Poor $45,198 |
| Whites/Caucasians | 15.0 /100 | #223 | Poor $45,197 |
| West Indians | 13.9 /100 | #224 | Poor $45,132 |
| Immigrants | Cambodia | 13.2 /100 | #225 | Poor $45,090 |
| Immigrants | Nigeria | 12.2 /100 | #226 | Poor $45,030 |
| Native Hawaiians | 12.2 /100 | #227 | Poor $45,027 |
| Immigrants | Iraq | 11.6 /100 | #228 | Poor $44,988 |
| Scotch-Irish | 10.7 /100 | #229 | Poor $44,924 |
| Immigrants | Western Africa | 10.3 /100 | #230 | Poor $44,893 |
| Japanese | 9.5 /100 | #231 | Tragic $44,825 |
| Delaware | 9.0 /100 | #232 | Tragic $44,783 |
Demographics Similar to Brazilians by Median Earnings
In terms of median earnings, the demographic groups most similar to Brazilians are Immigrants from Syria ($48,375, a difference of 0.040%), Immigrants from Fiji ($48,305, a difference of 0.11%), Assyrian/Chaldean/Syriac ($48,304, a difference of 0.11%), Sierra Leonean ($48,286, a difference of 0.15%), and Immigrants from Philippines ($48,266, a difference of 0.19%).
| Demographics | Rating | Rank | Median Earnings |
| Serbians | 95.9 /100 | #117 | Exceptional $48,677 |
| Immigrants | Jordan | 95.9 /100 | #118 | Exceptional $48,673 |
| Poles | 95.8 /100 | #119 | Exceptional $48,659 |
| Carpatho Rusyns | 95.5 /100 | #120 | Exceptional $48,617 |
| Arabs | 95.4 /100 | #121 | Exceptional $48,599 |
| Chileans | 94.8 /100 | #122 | Exceptional $48,504 |
| Immigrants | Syria | 93.9 /100 | #123 | Exceptional $48,375 |
| Brazilians | 93.7 /100 | #124 | Exceptional $48,356 |
| Immigrants | Fiji | 93.3 /100 | #125 | Exceptional $48,305 |
| Assyrians/Chaldeans/Syriacs | 93.3 /100 | #126 | Exceptional $48,304 |
| Sierra Leoneans | 93.1 /100 | #127 | Exceptional $48,286 |
| Immigrants | Philippines | 92.9 /100 | #128 | Exceptional $48,266 |
| Pakistanis | 92.8 /100 | #129 | Exceptional $48,254 |
| Zimbabweans | 92.6 /100 | #130 | Exceptional $48,229 |
| Lebanese | 92.5 /100 | #131 | Exceptional $48,226 |