Immigrants from India vs Brazilian Median Earnings
COMPARE
Immigrants from India
Brazilian
Median Earnings
Median Earnings Comparison
Immigrants from India
Brazilians
$60,648
MEDIAN EARNINGS
100.0/ 100
METRIC RATING
3rd/ 347
METRIC RANK
$48,356
MEDIAN EARNINGS
93.7/ 100
METRIC RATING
124th/ 347
METRIC RANK
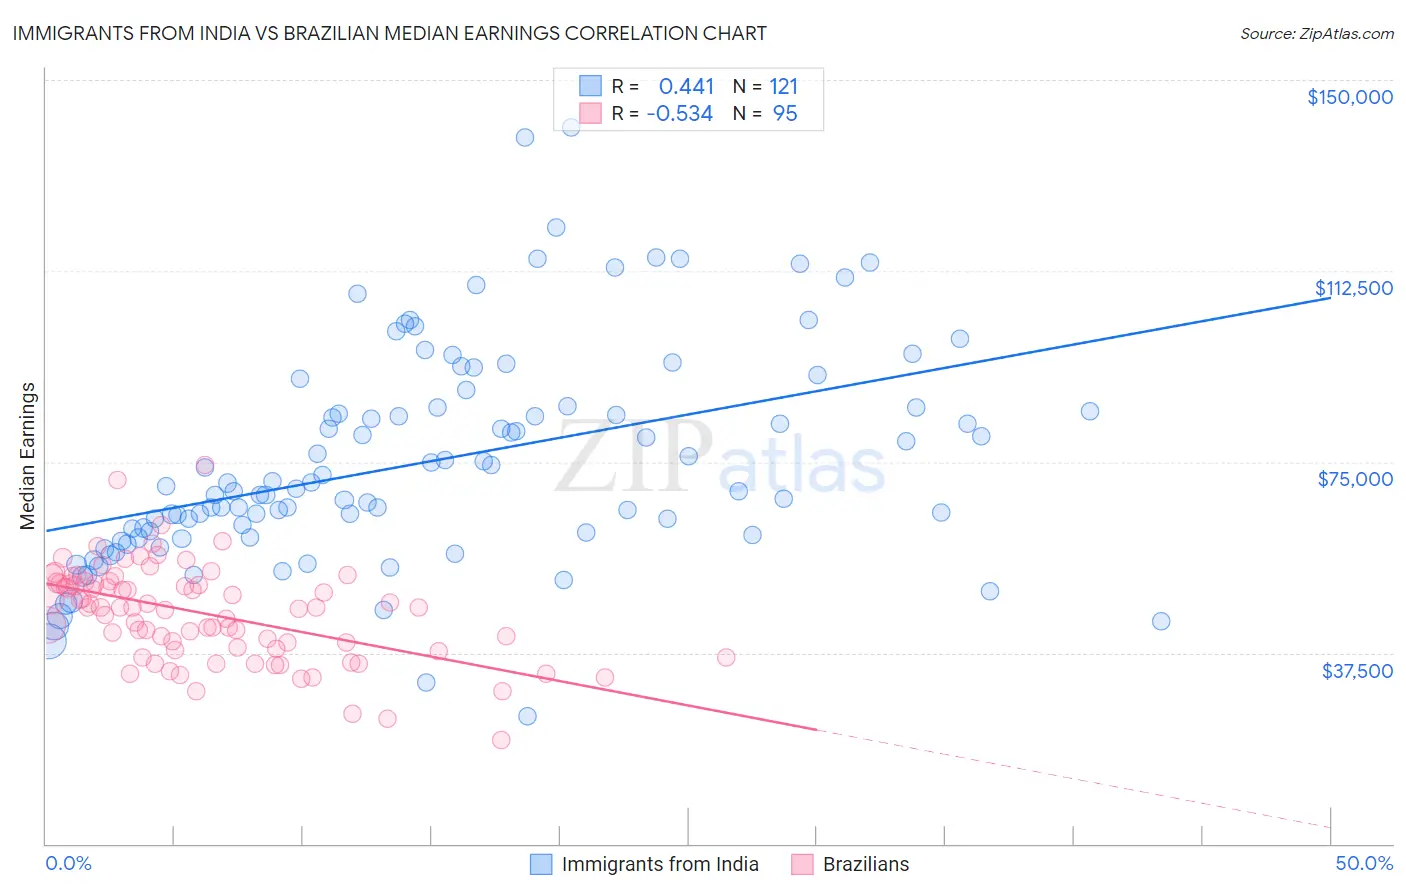
Immigrants from India vs Brazilian Median Earnings Correlation Chart
The statistical analysis conducted on geographies consisting of 434,105,381 people shows a moderate positive correlation between the proportion of Immigrants from India and median earnings in the United States with a correlation coefficient (R) of 0.441 and weighted average of $60,648. Similarly, the statistical analysis conducted on geographies consisting of 323,957,574 people shows a substantial negative correlation between the proportion of Brazilians and median earnings in the United States with a correlation coefficient (R) of -0.534 and weighted average of $48,356, a difference of 25.4%.
Median Earnings Correlation Summary
| Measurement | Immigrants from India | Brazilian |
| Minimum | $24,957 | $20,417 |
| Maximum | $140,742 | $74,375 |
| Range | $115,785 | $53,958 |
| Mean | $74,941 | $45,246 |
| Median | $69,769 | $46,406 |
| Interquartile 25% (IQ1) | $60,363 | $38,216 |
| Interquartile 75% (IQ3) | $85,753 | $51,116 |
| Interquartile Range (IQR) | $25,390 | $12,900 |
| Standard Deviation (Sample) | $21,309 | $9,424 |
| Standard Deviation (Population) | $21,220 | $9,375 |
Similar Demographics by Median Earnings
Demographics Similar to Immigrants from India by Median Earnings
In terms of median earnings, the demographic groups most similar to Immigrants from India are Immigrants from Taiwan ($61,151, a difference of 0.83%), Filipino ($61,197, a difference of 0.91%), Immigrants from Hong Kong ($59,433, a difference of 2.0%), Thai ($59,237, a difference of 2.4%), and Immigrants from Singapore ($59,038, a difference of 2.7%).
| Demographics | Rating | Rank | Median Earnings |
| Filipinos | 100.0 /100 | #1 | Exceptional $61,197 |
| Immigrants | Taiwan | 100.0 /100 | #2 | Exceptional $61,151 |
| Immigrants | India | 100.0 /100 | #3 | Exceptional $60,648 |
| Immigrants | Hong Kong | 100.0 /100 | #4 | Exceptional $59,433 |
| Thais | 100.0 /100 | #5 | Exceptional $59,237 |
| Immigrants | Singapore | 100.0 /100 | #6 | Exceptional $59,038 |
| Iranians | 100.0 /100 | #7 | Exceptional $58,474 |
| Immigrants | Iran | 100.0 /100 | #8 | Exceptional $57,612 |
| Okinawans | 100.0 /100 | #9 | Exceptional $57,550 |
| Immigrants | South Central Asia | 100.0 /100 | #10 | Exceptional $57,114 |
| Immigrants | Israel | 100.0 /100 | #11 | Exceptional $57,034 |
| Immigrants | Ireland | 100.0 /100 | #12 | Exceptional $56,854 |
| Immigrants | China | 100.0 /100 | #13 | Exceptional $56,638 |
| Immigrants | Australia | 100.0 /100 | #14 | Exceptional $56,305 |
| Indians (Asian) | 100.0 /100 | #15 | Exceptional $56,253 |
Demographics Similar to Brazilians by Median Earnings
In terms of median earnings, the demographic groups most similar to Brazilians are Immigrants from Syria ($48,375, a difference of 0.040%), Immigrants from Fiji ($48,305, a difference of 0.11%), Assyrian/Chaldean/Syriac ($48,304, a difference of 0.11%), Sierra Leonean ($48,286, a difference of 0.15%), and Immigrants from Philippines ($48,266, a difference of 0.19%).
| Demographics | Rating | Rank | Median Earnings |
| Serbians | 95.9 /100 | #117 | Exceptional $48,677 |
| Immigrants | Jordan | 95.9 /100 | #118 | Exceptional $48,673 |
| Poles | 95.8 /100 | #119 | Exceptional $48,659 |
| Carpatho Rusyns | 95.5 /100 | #120 | Exceptional $48,617 |
| Arabs | 95.4 /100 | #121 | Exceptional $48,599 |
| Chileans | 94.8 /100 | #122 | Exceptional $48,504 |
| Immigrants | Syria | 93.9 /100 | #123 | Exceptional $48,375 |
| Brazilians | 93.7 /100 | #124 | Exceptional $48,356 |
| Immigrants | Fiji | 93.3 /100 | #125 | Exceptional $48,305 |
| Assyrians/Chaldeans/Syriacs | 93.3 /100 | #126 | Exceptional $48,304 |
| Sierra Leoneans | 93.1 /100 | #127 | Exceptional $48,286 |
| Immigrants | Philippines | 92.9 /100 | #128 | Exceptional $48,266 |
| Pakistanis | 92.8 /100 | #129 | Exceptional $48,254 |
| Zimbabweans | 92.6 /100 | #130 | Exceptional $48,229 |
| Lebanese | 92.5 /100 | #131 | Exceptional $48,226 |