Immigrants from Western Africa vs Mexican American Indian Median Earnings
COMPARE
Immigrants from Western Africa
Mexican American Indian
Median Earnings
Median Earnings Comparison
Immigrants from Western Africa
Mexican American Indians
$44,893
MEDIAN EARNINGS
10.3/ 100
METRIC RATING
230th/ 347
METRIC RANK
$41,719
MEDIAN EARNINGS
0.1/ 100
METRIC RATING
286th/ 347
METRIC RANK
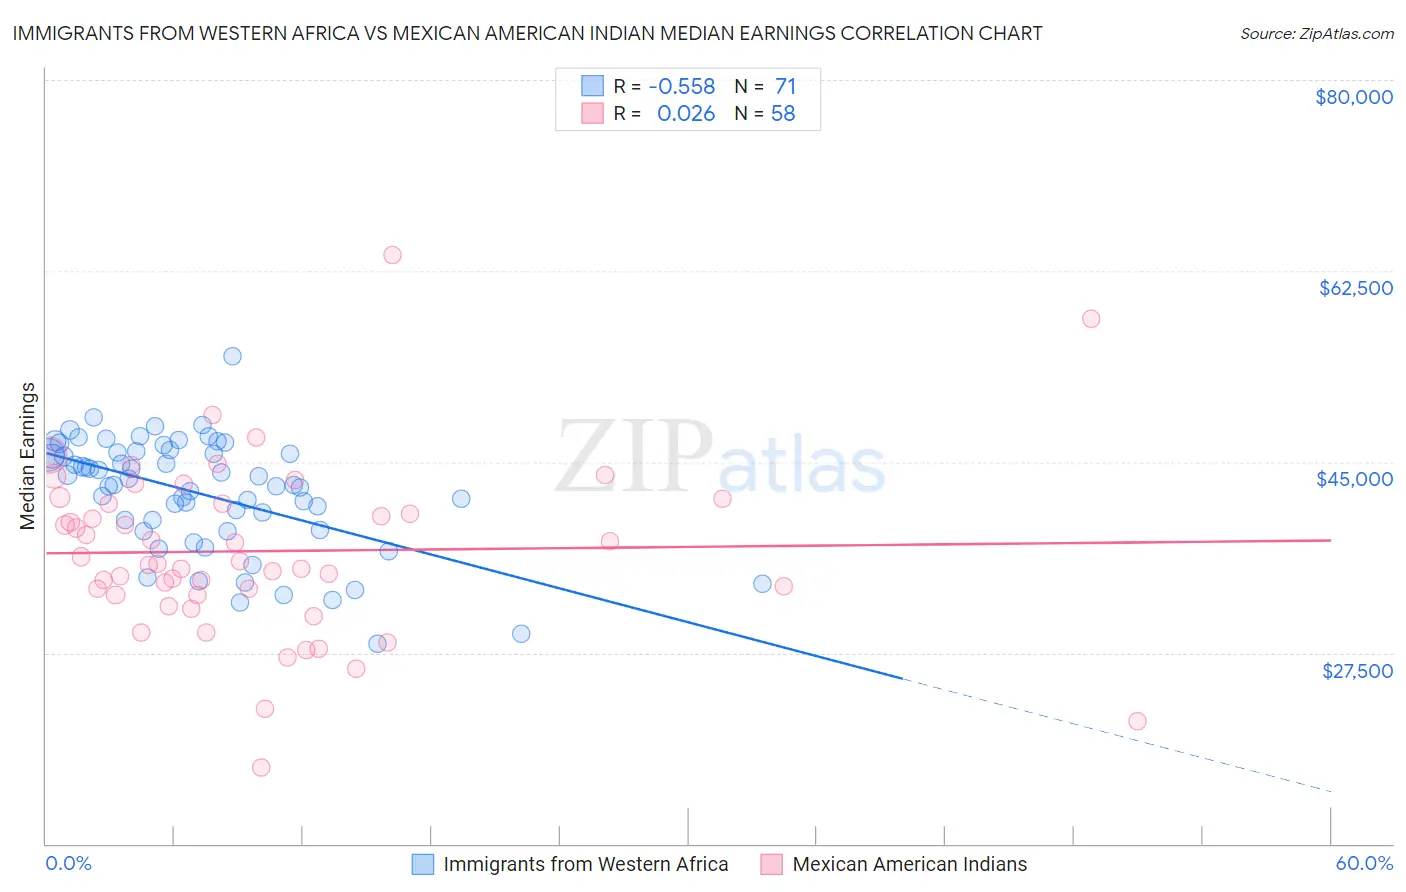
Immigrants from Western Africa vs Mexican American Indian Median Earnings Correlation Chart
The statistical analysis conducted on geographies consisting of 357,863,895 people shows a substantial negative correlation between the proportion of Immigrants from Western Africa and median earnings in the United States with a correlation coefficient (R) of -0.558 and weighted average of $44,893. Similarly, the statistical analysis conducted on geographies consisting of 317,581,604 people shows no correlation between the proportion of Mexican American Indians and median earnings in the United States with a correlation coefficient (R) of 0.026 and weighted average of $41,719, a difference of 7.6%.
Median Earnings Correlation Summary
| Measurement | Immigrants from Western Africa | Mexican American Indian |
| Minimum | $28,358 | $16,986 |
| Maximum | $54,719 | $63,917 |
| Range | $26,361 | $46,931 |
| Mean | $42,092 | $36,825 |
| Median | $42,904 | $35,754 |
| Interquartile 25% (IQ1) | $38,801 | $32,817 |
| Interquartile 75% (IQ3) | $45,834 | $41,197 |
| Interquartile Range (IQR) | $7,033 | $8,379 |
| Standard Deviation (Sample) | $5,206 | $7,970 |
| Standard Deviation (Population) | $5,170 | $7,901 |
Similar Demographics by Median Earnings
Demographics Similar to Immigrants from Western Africa by Median Earnings
In terms of median earnings, the demographic groups most similar to Immigrants from Western Africa are Scotch-Irish ($44,924, a difference of 0.070%), Japanese ($44,825, a difference of 0.15%), Immigrants from Iraq ($44,988, a difference of 0.21%), Delaware ($44,783, a difference of 0.24%), and Immigrants from Sudan ($44,767, a difference of 0.28%).
| Demographics | Rating | Rank | Median Earnings |
| Whites/Caucasians | 15.0 /100 | #223 | Poor $45,197 |
| West Indians | 13.9 /100 | #224 | Poor $45,132 |
| Immigrants | Cambodia | 13.2 /100 | #225 | Poor $45,090 |
| Immigrants | Nigeria | 12.2 /100 | #226 | Poor $45,030 |
| Native Hawaiians | 12.2 /100 | #227 | Poor $45,027 |
| Immigrants | Iraq | 11.6 /100 | #228 | Poor $44,988 |
| Scotch-Irish | 10.7 /100 | #229 | Poor $44,924 |
| Immigrants | Western Africa | 10.3 /100 | #230 | Poor $44,893 |
| Japanese | 9.5 /100 | #231 | Tragic $44,825 |
| Delaware | 9.0 /100 | #232 | Tragic $44,783 |
| Immigrants | Sudan | 8.8 /100 | #233 | Tragic $44,767 |
| Cape Verdeans | 7.5 /100 | #234 | Tragic $44,640 |
| Venezuelans | 6.9 /100 | #235 | Tragic $44,580 |
| British West Indians | 6.7 /100 | #236 | Tragic $44,552 |
| Immigrants | Ecuador | 5.9 /100 | #237 | Tragic $44,462 |
Demographics Similar to Mexican American Indians by Median Earnings
In terms of median earnings, the demographic groups most similar to Mexican American Indians are Immigrants from Nicaragua ($41,737, a difference of 0.040%), Indonesian ($41,701, a difference of 0.040%), Blackfeet ($41,822, a difference of 0.25%), Dominican ($41,864, a difference of 0.35%), and Immigrants from Dominican Republic ($41,554, a difference of 0.40%).
| Demographics | Rating | Rank | Median Earnings |
| Colville | 0.2 /100 | #279 | Tragic $42,151 |
| Hmong | 0.2 /100 | #280 | Tragic $42,111 |
| Marshallese | 0.2 /100 | #281 | Tragic $41,969 |
| Africans | 0.2 /100 | #282 | Tragic $41,955 |
| Dominicans | 0.2 /100 | #283 | Tragic $41,864 |
| Blackfeet | 0.2 /100 | #284 | Tragic $41,822 |
| Immigrants | Nicaragua | 0.1 /100 | #285 | Tragic $41,737 |
| Mexican American Indians | 0.1 /100 | #286 | Tragic $41,719 |
| Indonesians | 0.1 /100 | #287 | Tragic $41,701 |
| Immigrants | Dominican Republic | 0.1 /100 | #288 | Tragic $41,554 |
| Comanche | 0.1 /100 | #289 | Tragic $41,519 |
| Paiute | 0.1 /100 | #290 | Tragic $41,508 |
| Central American Indians | 0.1 /100 | #291 | Tragic $41,474 |
| U.S. Virgin Islanders | 0.1 /100 | #292 | Tragic $41,448 |
| Immigrants | Zaire | 0.1 /100 | #293 | Tragic $41,325 |