Immigrants from Western Africa vs Immigrants from Fiji Median Earnings
COMPARE
Immigrants from Western Africa
Immigrants from Fiji
Median Earnings
Median Earnings Comparison
Immigrants from Western Africa
Immigrants from Fiji
$44,893
MEDIAN EARNINGS
10.3/ 100
METRIC RATING
230th/ 347
METRIC RANK
$48,305
MEDIAN EARNINGS
93.3/ 100
METRIC RATING
125th/ 347
METRIC RANK
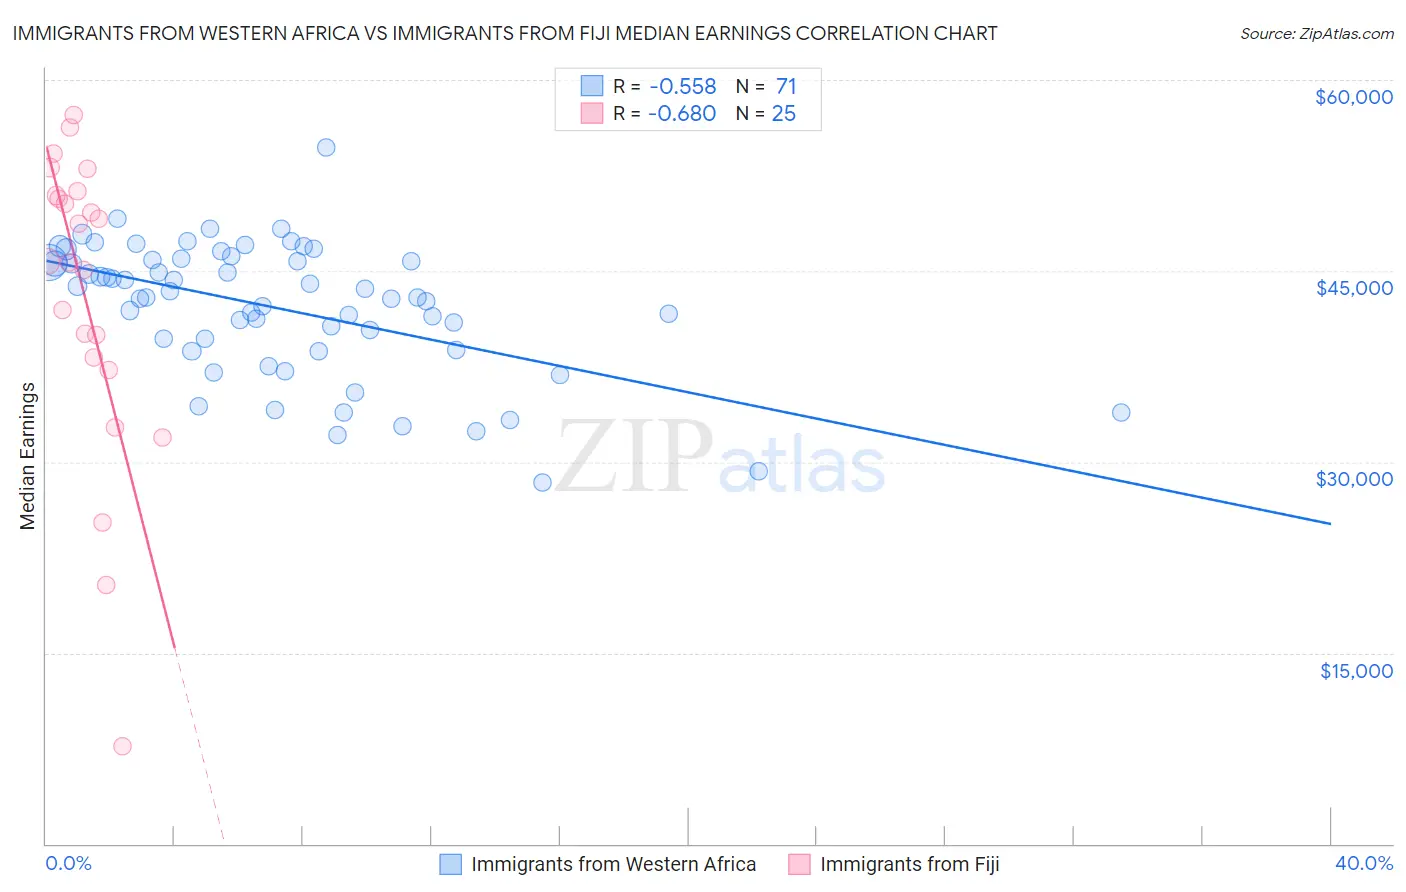
Immigrants from Western Africa vs Immigrants from Fiji Median Earnings Correlation Chart
The statistical analysis conducted on geographies consisting of 357,863,895 people shows a substantial negative correlation between the proportion of Immigrants from Western Africa and median earnings in the United States with a correlation coefficient (R) of -0.558 and weighted average of $44,893. Similarly, the statistical analysis conducted on geographies consisting of 93,756,016 people shows a significant negative correlation between the proportion of Immigrants from Fiji and median earnings in the United States with a correlation coefficient (R) of -0.680 and weighted average of $48,305, a difference of 7.6%.
Median Earnings Correlation Summary
| Measurement | Immigrants from Western Africa | Immigrants from Fiji |
| Minimum | $28,358 | $7,703 |
| Maximum | $54,719 | $57,229 |
| Range | $26,361 | $49,526 |
| Mean | $42,092 | $43,044 |
| Median | $42,904 | $45,776 |
| Interquartile 25% (IQ1) | $38,801 | $37,711 |
| Interquartile 75% (IQ3) | $45,834 | $51,118 |
| Interquartile Range (IQR) | $7,033 | $13,407 |
| Standard Deviation (Sample) | $5,206 | $12,014 |
| Standard Deviation (Population) | $5,170 | $11,772 |
Similar Demographics by Median Earnings
Demographics Similar to Immigrants from Western Africa by Median Earnings
In terms of median earnings, the demographic groups most similar to Immigrants from Western Africa are Scotch-Irish ($44,924, a difference of 0.070%), Japanese ($44,825, a difference of 0.15%), Immigrants from Iraq ($44,988, a difference of 0.21%), Delaware ($44,783, a difference of 0.24%), and Immigrants from Sudan ($44,767, a difference of 0.28%).
| Demographics | Rating | Rank | Median Earnings |
| Whites/Caucasians | 15.0 /100 | #223 | Poor $45,197 |
| West Indians | 13.9 /100 | #224 | Poor $45,132 |
| Immigrants | Cambodia | 13.2 /100 | #225 | Poor $45,090 |
| Immigrants | Nigeria | 12.2 /100 | #226 | Poor $45,030 |
| Native Hawaiians | 12.2 /100 | #227 | Poor $45,027 |
| Immigrants | Iraq | 11.6 /100 | #228 | Poor $44,988 |
| Scotch-Irish | 10.7 /100 | #229 | Poor $44,924 |
| Immigrants | Western Africa | 10.3 /100 | #230 | Poor $44,893 |
| Japanese | 9.5 /100 | #231 | Tragic $44,825 |
| Delaware | 9.0 /100 | #232 | Tragic $44,783 |
| Immigrants | Sudan | 8.8 /100 | #233 | Tragic $44,767 |
| Cape Verdeans | 7.5 /100 | #234 | Tragic $44,640 |
| Venezuelans | 6.9 /100 | #235 | Tragic $44,580 |
| British West Indians | 6.7 /100 | #236 | Tragic $44,552 |
| Immigrants | Ecuador | 5.9 /100 | #237 | Tragic $44,462 |
Demographics Similar to Immigrants from Fiji by Median Earnings
In terms of median earnings, the demographic groups most similar to Immigrants from Fiji are Assyrian/Chaldean/Syriac ($48,304, a difference of 0.0%), Sierra Leonean ($48,286, a difference of 0.040%), Immigrants from Philippines ($48,266, a difference of 0.080%), Brazilian ($48,356, a difference of 0.11%), and Pakistani ($48,254, a difference of 0.11%).
| Demographics | Rating | Rank | Median Earnings |
| Immigrants | Jordan | 95.9 /100 | #118 | Exceptional $48,673 |
| Poles | 95.8 /100 | #119 | Exceptional $48,659 |
| Carpatho Rusyns | 95.5 /100 | #120 | Exceptional $48,617 |
| Arabs | 95.4 /100 | #121 | Exceptional $48,599 |
| Chileans | 94.8 /100 | #122 | Exceptional $48,504 |
| Immigrants | Syria | 93.9 /100 | #123 | Exceptional $48,375 |
| Brazilians | 93.7 /100 | #124 | Exceptional $48,356 |
| Immigrants | Fiji | 93.3 /100 | #125 | Exceptional $48,305 |
| Assyrians/Chaldeans/Syriacs | 93.3 /100 | #126 | Exceptional $48,304 |
| Sierra Leoneans | 93.1 /100 | #127 | Exceptional $48,286 |
| Immigrants | Philippines | 92.9 /100 | #128 | Exceptional $48,266 |
| Pakistanis | 92.8 /100 | #129 | Exceptional $48,254 |
| Zimbabweans | 92.6 /100 | #130 | Exceptional $48,229 |
| Lebanese | 92.5 /100 | #131 | Exceptional $48,226 |
| British | 92.2 /100 | #132 | Exceptional $48,189 |