Immigrants from West Indies vs French American Indian Median Male Earnings
COMPARE
Immigrants from West Indies
French American Indian
Median Male Earnings
Median Male Earnings Comparison
Immigrants from West Indies
French American Indians
$49,271
MEDIAN MALE EARNINGS
0.6/ 100
METRIC RATING
262nd/ 347
METRIC RANK
$50,611
MEDIAN MALE EARNINGS
2.2/ 100
METRIC RATING
243rd/ 347
METRIC RANK
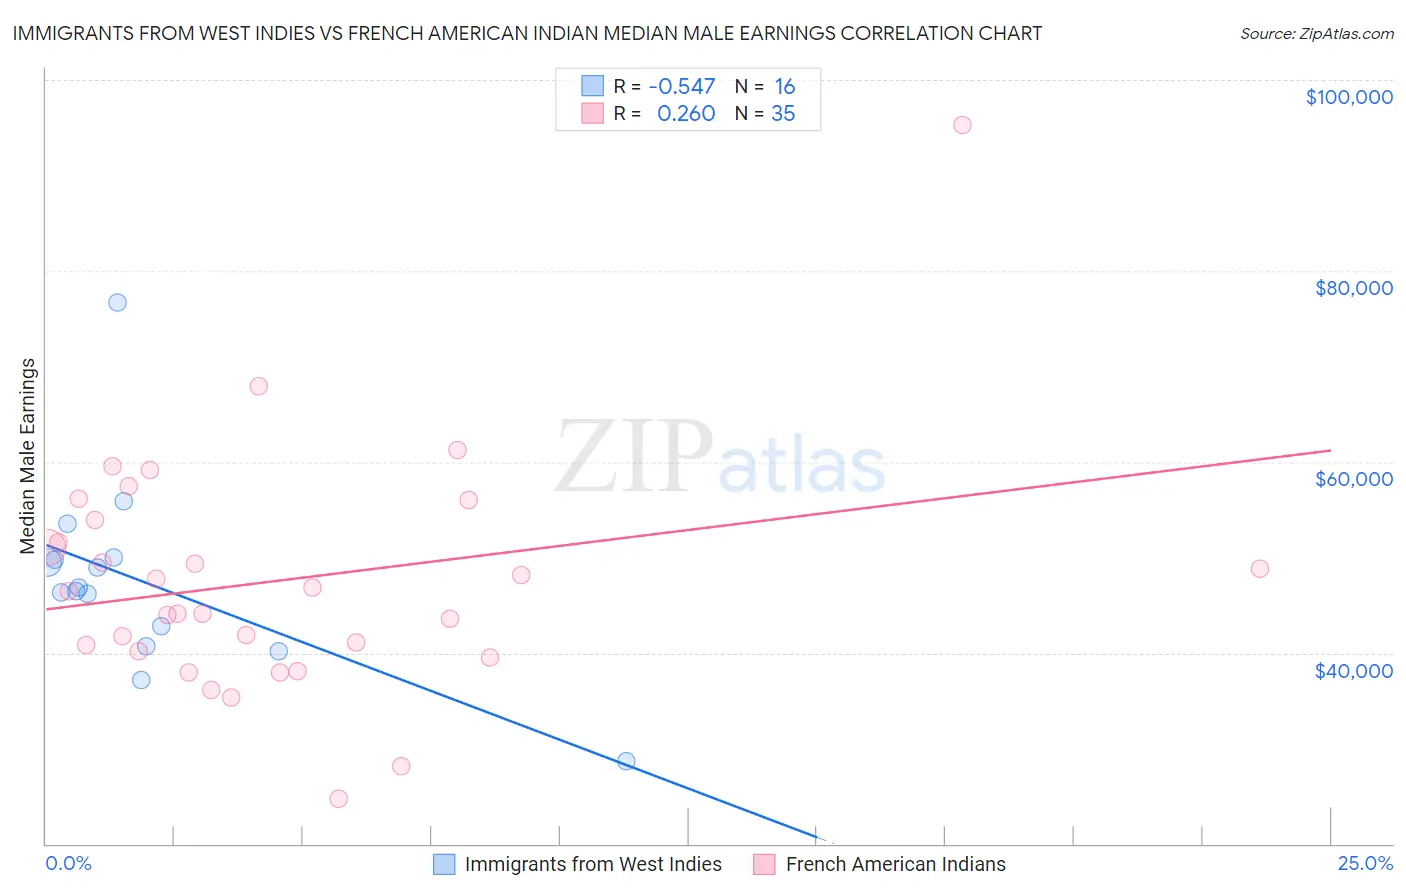
Immigrants from West Indies vs French American Indian Median Male Earnings Correlation Chart
The statistical analysis conducted on geographies consisting of 72,416,935 people shows a substantial negative correlation between the proportion of Immigrants from West Indies and median male earnings in the United States with a correlation coefficient (R) of -0.547 and weighted average of $49,271. Similarly, the statistical analysis conducted on geographies consisting of 131,955,005 people shows a weak positive correlation between the proportion of French American Indians and median male earnings in the United States with a correlation coefficient (R) of 0.260 and weighted average of $50,611, a difference of 2.7%.
Median Male Earnings Correlation Summary
| Measurement | Immigrants from West Indies | French American Indian |
| Minimum | $28,702 | $24,718 |
| Maximum | $76,711 | $95,250 |
| Range | $48,009 | $70,532 |
| Mean | $47,473 | $47,583 |
| Median | $46,662 | $46,502 |
| Interquartile 25% (IQ1) | $41,722 | $40,215 |
| Interquartile 75% (IQ3) | $49,852 | $53,921 |
| Interquartile Range (IQR) | $8,130 | $13,706 |
| Standard Deviation (Sample) | $10,214 | $12,435 |
| Standard Deviation (Population) | $9,890 | $12,256 |
Demographics Similar to Immigrants from West Indies and French American Indians by Median Male Earnings
In terms of median male earnings, the demographic groups most similar to Immigrants from West Indies are Liberian ($49,318, a difference of 0.10%), Iroquois ($49,374, a difference of 0.21%), Nepalese ($49,458, a difference of 0.38%), Cree ($49,497, a difference of 0.46%), and British West Indian ($49,636, a difference of 0.74%). Similarly, the demographic groups most similar to French American Indians are Guyanese ($50,613, a difference of 0.0%), Houma ($50,547, a difference of 0.13%), Hawaiian ($50,488, a difference of 0.24%), Immigrants from Ecuador ($50,474, a difference of 0.27%), and Subsaharan African ($50,408, a difference of 0.40%).
| Demographics | Rating | Rank | Median Male Earnings |
| Guyanese | 2.2 /100 | #242 | Tragic $50,613 |
| French American Indians | 2.2 /100 | #243 | Tragic $50,611 |
| Houma | 2.0 /100 | #244 | Tragic $50,547 |
| Hawaiians | 1.9 /100 | #245 | Tragic $50,488 |
| Immigrants | Ecuador | 1.9 /100 | #246 | Tragic $50,474 |
| Sub-Saharan Africans | 1.8 /100 | #247 | Tragic $50,408 |
| Immigrants | Guyana | 1.6 /100 | #248 | Tragic $50,321 |
| Immigrants | Burma/Myanmar | 1.6 /100 | #249 | Tragic $50,298 |
| Osage | 1.6 /100 | #250 | Tragic $50,292 |
| Immigrants | Grenada | 1.6 /100 | #251 | Tragic $50,279 |
| Immigrants | Cabo Verde | 1.2 /100 | #252 | Tragic $50,009 |
| German Russians | 1.1 /100 | #253 | Tragic $49,924 |
| Senegalese | 1.0 /100 | #254 | Tragic $49,774 |
| Alaskan Athabascans | 0.9 /100 | #255 | Tragic $49,748 |
| Alaska Natives | 0.9 /100 | #256 | Tragic $49,711 |
| British West Indians | 0.8 /100 | #257 | Tragic $49,636 |
| Cree | 0.7 /100 | #258 | Tragic $49,497 |
| Nepalese | 0.7 /100 | #259 | Tragic $49,458 |
| Iroquois | 0.7 /100 | #260 | Tragic $49,374 |
| Liberians | 0.6 /100 | #261 | Tragic $49,318 |
| Immigrants | West Indies | 0.6 /100 | #262 | Tragic $49,271 |