Immigrants from Vietnam vs Immigrants from Western Europe Median Earnings
COMPARE
Immigrants from Vietnam
Immigrants from Western Europe
Median Earnings
Median Earnings Comparison
Immigrants from Vietnam
Immigrants from Western Europe
$47,282
MEDIAN EARNINGS
76.7/ 100
METRIC RATING
155th/ 347
METRIC RANK
$50,549
MEDIAN EARNINGS
99.7/ 100
METRIC RATING
77th/ 347
METRIC RANK
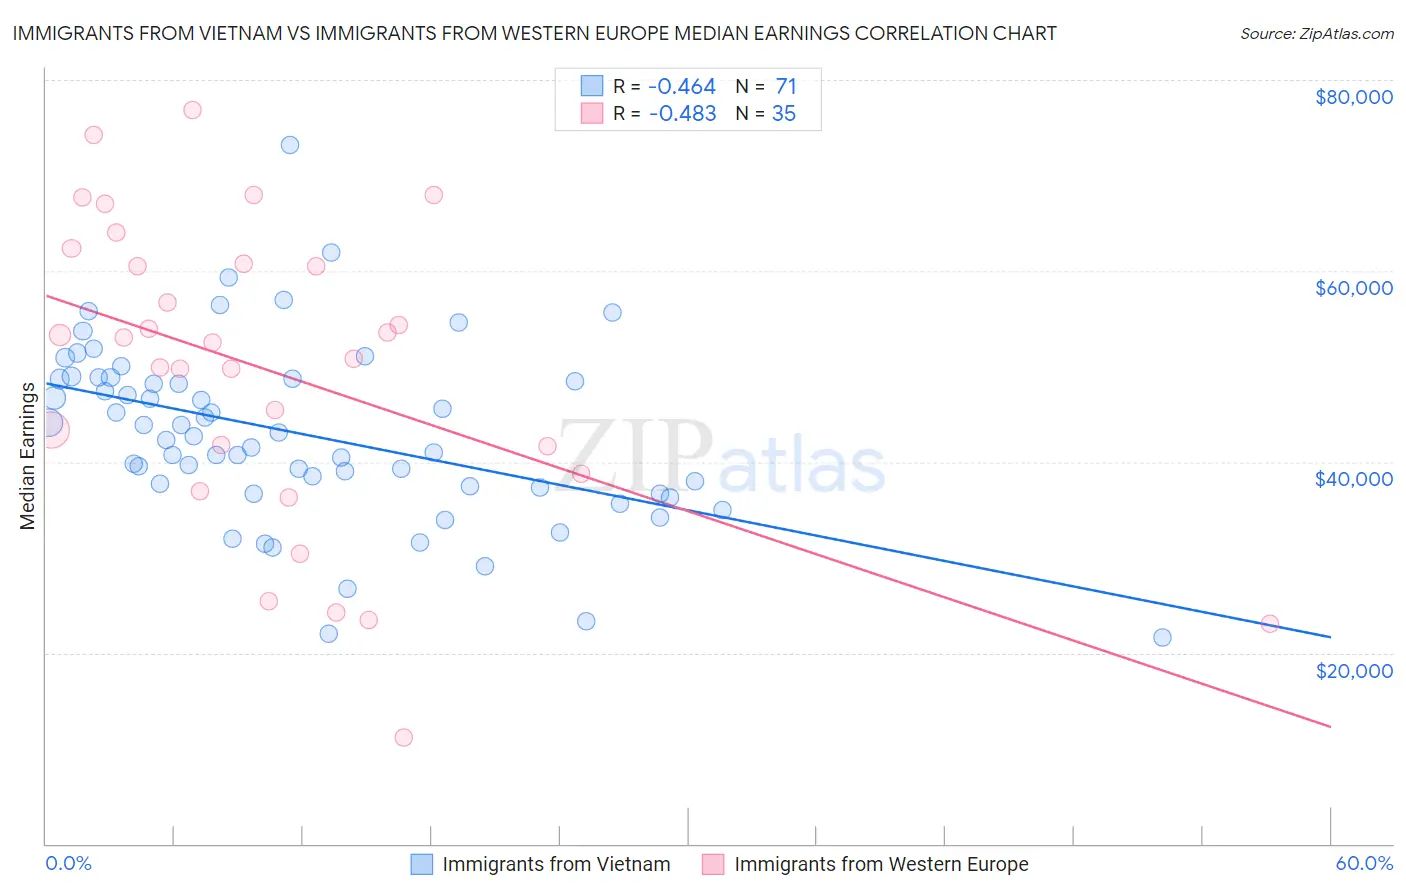
Immigrants from Vietnam vs Immigrants from Western Europe Median Earnings Correlation Chart
The statistical analysis conducted on geographies consisting of 404,676,863 people shows a moderate negative correlation between the proportion of Immigrants from Vietnam and median earnings in the United States with a correlation coefficient (R) of -0.464 and weighted average of $47,282. Similarly, the statistical analysis conducted on geographies consisting of 493,982,841 people shows a moderate negative correlation between the proportion of Immigrants from Western Europe and median earnings in the United States with a correlation coefficient (R) of -0.483 and weighted average of $50,549, a difference of 6.9%.
Median Earnings Correlation Summary
| Measurement | Immigrants from Vietnam | Immigrants from Western Europe |
| Minimum | $21,667 | $11,184 |
| Maximum | $73,212 | $76,795 |
| Range | $51,545 | $65,611 |
| Mean | $42,907 | $49,401 |
| Median | $42,737 | $52,565 |
| Interquartile 25% (IQ1) | $37,299 | $38,750 |
| Interquartile 75% (IQ3) | $48,750 | $60,761 |
| Interquartile Range (IQR) | $11,451 | $22,011 |
| Standard Deviation (Sample) | $9,399 | $15,918 |
| Standard Deviation (Population) | $9,333 | $15,689 |
Similar Demographics by Median Earnings
Demographics Similar to Immigrants from Vietnam by Median Earnings
In terms of median earnings, the demographic groups most similar to Immigrants from Vietnam are Irish ($47,276, a difference of 0.010%), Immigrants from Portugal ($47,304, a difference of 0.050%), Czech ($47,221, a difference of 0.13%), Slavic ($47,470, a difference of 0.40%), and Slovak ($47,095, a difference of 0.40%).
| Demographics | Rating | Rank | Median Earnings |
| Immigrants | Eritrea | 84.8 /100 | #148 | Excellent $47,657 |
| Luxembourgers | 84.5 /100 | #149 | Excellent $47,640 |
| Peruvians | 84.2 /100 | #150 | Excellent $47,628 |
| Immigrants | Oceania | 84.1 /100 | #151 | Excellent $47,617 |
| Immigrants | Germany | 83.1 /100 | #152 | Excellent $47,566 |
| Slavs | 81.1 /100 | #153 | Excellent $47,470 |
| Immigrants | Portugal | 77.3 /100 | #154 | Good $47,304 |
| Immigrants | Vietnam | 76.7 /100 | #155 | Good $47,282 |
| Irish | 76.6 /100 | #156 | Good $47,276 |
| Czechs | 75.1 /100 | #157 | Good $47,221 |
| Slovaks | 71.7 /100 | #158 | Good $47,095 |
| Immigrants | Peru | 69.6 /100 | #159 | Good $47,025 |
| Alsatians | 69.6 /100 | #160 | Good $47,023 |
| Immigrants | Eastern Africa | 68.0 /100 | #161 | Good $46,969 |
| South American Indians | 67.4 /100 | #162 | Good $46,952 |
Demographics Similar to Immigrants from Western Europe by Median Earnings
In terms of median earnings, the demographic groups most similar to Immigrants from Western Europe are Immigrants from Italy ($50,581, a difference of 0.060%), Argentinean ($50,399, a difference of 0.30%), Immigrants from Scotland ($50,741, a difference of 0.38%), South African ($50,752, a difference of 0.40%), and Laotian ($50,343, a difference of 0.41%).
| Demographics | Rating | Rank | Median Earnings |
| Lithuanians | 99.8 /100 | #70 | Exceptional $50,991 |
| Immigrants | Ukraine | 99.8 /100 | #71 | Exceptional $50,984 |
| Immigrants | Egypt | 99.8 /100 | #72 | Exceptional $50,901 |
| Immigrants | Netherlands | 99.8 /100 | #73 | Exceptional $50,818 |
| South Africans | 99.8 /100 | #74 | Exceptional $50,752 |
| Immigrants | Scotland | 99.8 /100 | #75 | Exceptional $50,741 |
| Immigrants | Italy | 99.7 /100 | #76 | Exceptional $50,581 |
| Immigrants | Western Europe | 99.7 /100 | #77 | Exceptional $50,549 |
| Argentineans | 99.6 /100 | #78 | Exceptional $50,399 |
| Laotians | 99.6 /100 | #79 | Exceptional $50,343 |
| Ukrainians | 99.6 /100 | #80 | Exceptional $50,320 |
| Immigrants | Southern Europe | 99.6 /100 | #81 | Exceptional $50,280 |
| Immigrants | Moldova | 99.5 /100 | #82 | Exceptional $50,274 |
| Romanians | 99.5 /100 | #83 | Exceptional $50,244 |
| Immigrants | Hungary | 99.5 /100 | #84 | Exceptional $50,227 |