Immigrants from Vietnam vs Puerto Rican Median Earnings
COMPARE
Immigrants from Vietnam
Puerto Rican
Median Earnings
Median Earnings Comparison
Immigrants from Vietnam
Puerto Ricans
$47,282
MEDIAN EARNINGS
76.7/ 100
METRIC RATING
155th/ 347
METRIC RANK
$35,560
MEDIAN EARNINGS
0.0/ 100
METRIC RATING
347th/ 347
METRIC RANK
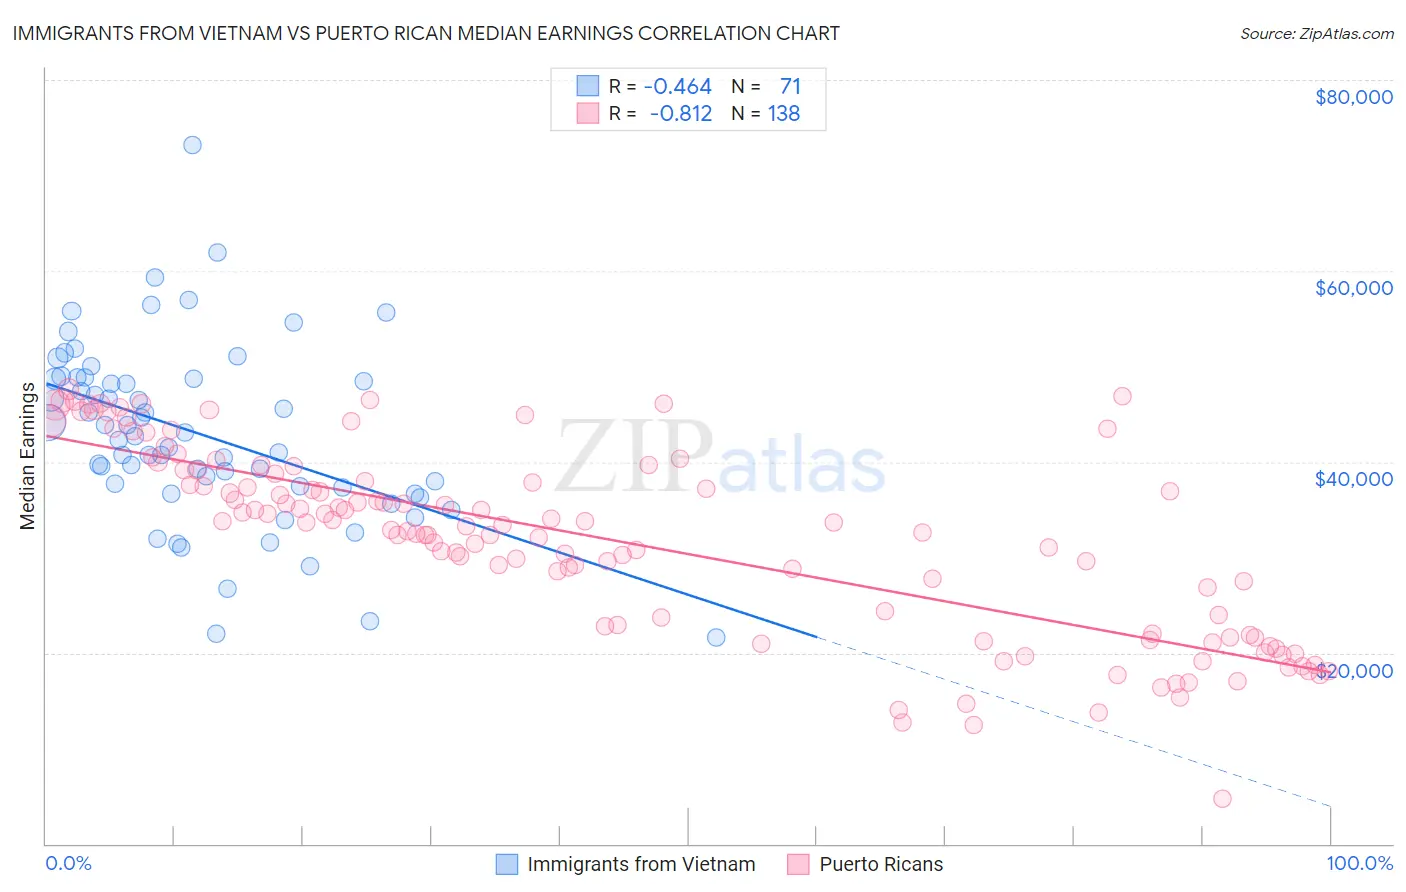
Immigrants from Vietnam vs Puerto Rican Median Earnings Correlation Chart
The statistical analysis conducted on geographies consisting of 404,676,863 people shows a moderate negative correlation between the proportion of Immigrants from Vietnam and median earnings in the United States with a correlation coefficient (R) of -0.464 and weighted average of $47,282. Similarly, the statistical analysis conducted on geographies consisting of 528,218,544 people shows a very strong negative correlation between the proportion of Puerto Ricans and median earnings in the United States with a correlation coefficient (R) of -0.812 and weighted average of $35,560, a difference of 33.0%.
Median Earnings Correlation Summary
| Measurement | Immigrants from Vietnam | Puerto Rican |
| Minimum | $21,667 | $4,737 |
| Maximum | $73,212 | $47,601 |
| Range | $51,545 | $42,864 |
| Mean | $42,907 | $31,795 |
| Median | $42,737 | $33,297 |
| Interquartile 25% (IQ1) | $37,299 | $22,818 |
| Interquartile 75% (IQ3) | $48,750 | $39,100 |
| Interquartile Range (IQR) | $11,451 | $16,282 |
| Standard Deviation (Sample) | $9,399 | $9,771 |
| Standard Deviation (Population) | $9,333 | $9,736 |
Similar Demographics by Median Earnings
Demographics Similar to Immigrants from Vietnam by Median Earnings
In terms of median earnings, the demographic groups most similar to Immigrants from Vietnam are Irish ($47,276, a difference of 0.010%), Immigrants from Portugal ($47,304, a difference of 0.050%), Czech ($47,221, a difference of 0.13%), Slavic ($47,470, a difference of 0.40%), and Slovak ($47,095, a difference of 0.40%).
| Demographics | Rating | Rank | Median Earnings |
| Immigrants | Eritrea | 84.8 /100 | #148 | Excellent $47,657 |
| Luxembourgers | 84.5 /100 | #149 | Excellent $47,640 |
| Peruvians | 84.2 /100 | #150 | Excellent $47,628 |
| Immigrants | Oceania | 84.1 /100 | #151 | Excellent $47,617 |
| Immigrants | Germany | 83.1 /100 | #152 | Excellent $47,566 |
| Slavs | 81.1 /100 | #153 | Excellent $47,470 |
| Immigrants | Portugal | 77.3 /100 | #154 | Good $47,304 |
| Immigrants | Vietnam | 76.7 /100 | #155 | Good $47,282 |
| Irish | 76.6 /100 | #156 | Good $47,276 |
| Czechs | 75.1 /100 | #157 | Good $47,221 |
| Slovaks | 71.7 /100 | #158 | Good $47,095 |
| Immigrants | Peru | 69.6 /100 | #159 | Good $47,025 |
| Alsatians | 69.6 /100 | #160 | Good $47,023 |
| Immigrants | Eastern Africa | 68.0 /100 | #161 | Good $46,969 |
| South American Indians | 67.4 /100 | #162 | Good $46,952 |
Demographics Similar to Puerto Ricans by Median Earnings
In terms of median earnings, the demographic groups most similar to Puerto Ricans are Yup'ik ($35,942, a difference of 1.1%), Tohono O'odham ($36,349, a difference of 2.2%), Arapaho ($36,586, a difference of 2.9%), Pueblo ($36,859, a difference of 3.6%), and Hopi ($36,871, a difference of 3.7%).
| Demographics | Rating | Rank | Median Earnings |
| Houma | 0.0 /100 | #333 | Tragic $38,949 |
| Spanish American Indians | 0.0 /100 | #334 | Tragic $38,907 |
| Natives/Alaskans | 0.0 /100 | #335 | Tragic $38,896 |
| Crow | 0.0 /100 | #336 | Tragic $38,707 |
| Immigrants | Cuba | 0.0 /100 | #337 | Tragic $38,426 |
| Pima | 0.0 /100 | #338 | Tragic $38,285 |
| Menominee | 0.0 /100 | #339 | Tragic $37,884 |
| Navajo | 0.0 /100 | #340 | Tragic $36,999 |
| Lumbee | 0.0 /100 | #341 | Tragic $36,876 |
| Hopi | 0.0 /100 | #342 | Tragic $36,871 |
| Pueblo | 0.0 /100 | #343 | Tragic $36,859 |
| Arapaho | 0.0 /100 | #344 | Tragic $36,586 |
| Tohono O'odham | 0.0 /100 | #345 | Tragic $36,349 |
| Yup'ik | 0.0 /100 | #346 | Tragic $35,942 |
| Puerto Ricans | 0.0 /100 | #347 | Tragic $35,560 |