Immigrants from Vietnam vs Black/African American Median Earnings
COMPARE
Immigrants from Vietnam
Black/African American
Median Earnings
Median Earnings Comparison
Immigrants from Vietnam
Blacks/African Americans
$47,282
MEDIAN EARNINGS
76.7/ 100
METRIC RATING
155th/ 347
METRIC RANK
$40,085
MEDIAN EARNINGS
0.0/ 100
METRIC RATING
319th/ 347
METRIC RANK
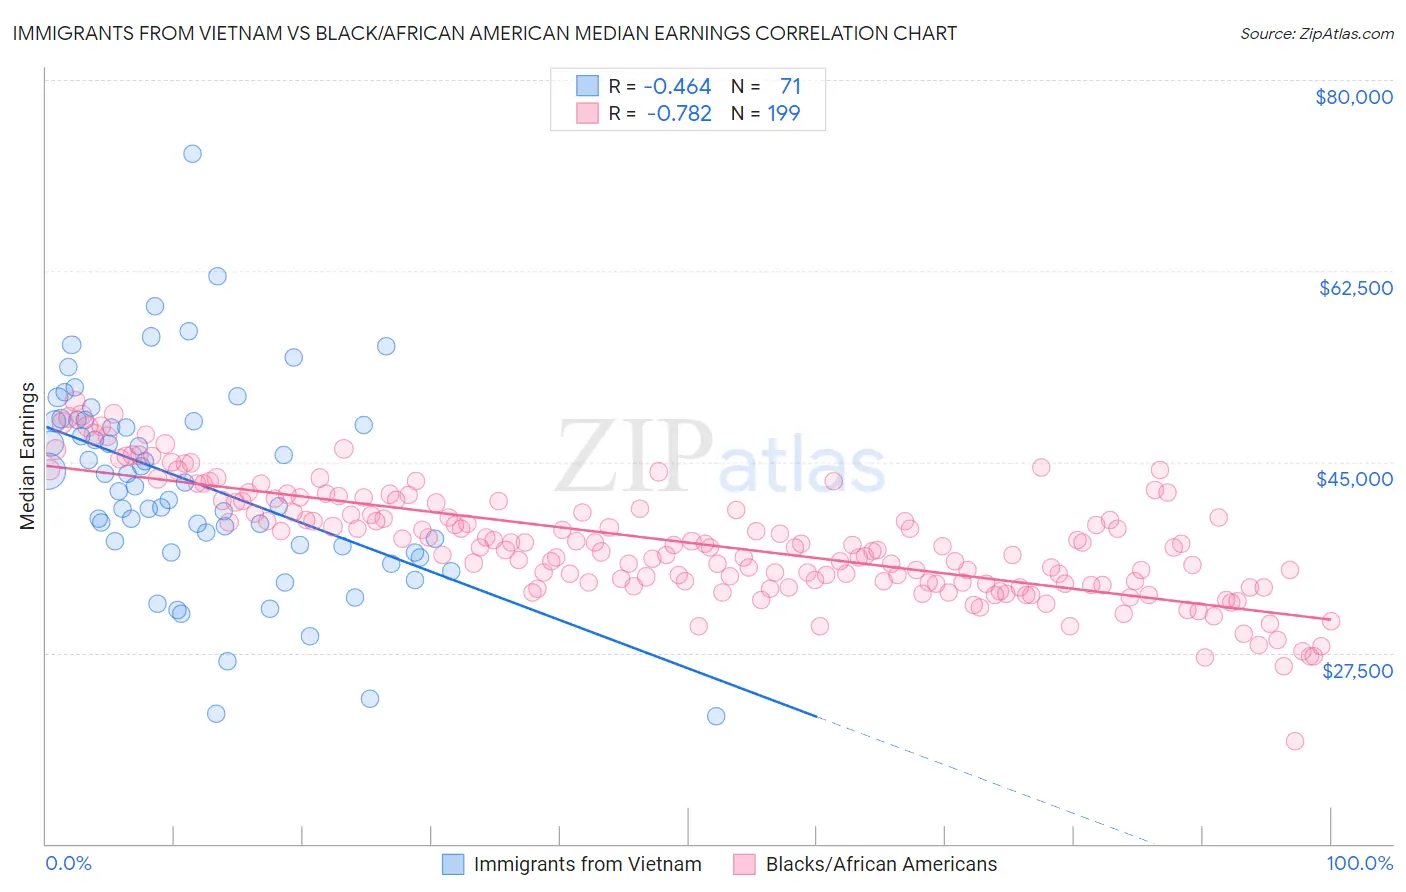
Immigrants from Vietnam vs Black/African American Median Earnings Correlation Chart
The statistical analysis conducted on geographies consisting of 404,676,863 people shows a moderate negative correlation between the proportion of Immigrants from Vietnam and median earnings in the United States with a correlation coefficient (R) of -0.464 and weighted average of $47,282. Similarly, the statistical analysis conducted on geographies consisting of 564,527,137 people shows a strong negative correlation between the proportion of Blacks/African Americans and median earnings in the United States with a correlation coefficient (R) of -0.782 and weighted average of $40,085, a difference of 17.9%.
Median Earnings Correlation Summary
| Measurement | Immigrants from Vietnam | Black/African American |
| Minimum | $21,667 | $19,448 |
| Maximum | $73,212 | $50,539 |
| Range | $51,545 | $31,091 |
| Mean | $42,907 | $37,581 |
| Median | $42,737 | $37,241 |
| Interquartile 25% (IQ1) | $37,299 | $33,915 |
| Interquartile 75% (IQ3) | $48,750 | $41,371 |
| Interquartile Range (IQR) | $11,451 | $7,457 |
| Standard Deviation (Sample) | $9,399 | $5,238 |
| Standard Deviation (Population) | $9,333 | $5,225 |
Similar Demographics by Median Earnings
Demographics Similar to Immigrants from Vietnam by Median Earnings
In terms of median earnings, the demographic groups most similar to Immigrants from Vietnam are Irish ($47,276, a difference of 0.010%), Immigrants from Portugal ($47,304, a difference of 0.050%), Czech ($47,221, a difference of 0.13%), Slavic ($47,470, a difference of 0.40%), and Slovak ($47,095, a difference of 0.40%).
| Demographics | Rating | Rank | Median Earnings |
| Immigrants | Eritrea | 84.8 /100 | #148 | Excellent $47,657 |
| Luxembourgers | 84.5 /100 | #149 | Excellent $47,640 |
| Peruvians | 84.2 /100 | #150 | Excellent $47,628 |
| Immigrants | Oceania | 84.1 /100 | #151 | Excellent $47,617 |
| Immigrants | Germany | 83.1 /100 | #152 | Excellent $47,566 |
| Slavs | 81.1 /100 | #153 | Excellent $47,470 |
| Immigrants | Portugal | 77.3 /100 | #154 | Good $47,304 |
| Immigrants | Vietnam | 76.7 /100 | #155 | Good $47,282 |
| Irish | 76.6 /100 | #156 | Good $47,276 |
| Czechs | 75.1 /100 | #157 | Good $47,221 |
| Slovaks | 71.7 /100 | #158 | Good $47,095 |
| Immigrants | Peru | 69.6 /100 | #159 | Good $47,025 |
| Alsatians | 69.6 /100 | #160 | Good $47,023 |
| Immigrants | Eastern Africa | 68.0 /100 | #161 | Good $46,969 |
| South American Indians | 67.4 /100 | #162 | Good $46,952 |
Demographics Similar to Blacks/African Americans by Median Earnings
In terms of median earnings, the demographic groups most similar to Blacks/African Americans are Dutch West Indian ($40,107, a difference of 0.060%), Immigrants from Honduras ($40,195, a difference of 0.27%), Fijian ($40,193, a difference of 0.27%), Cheyenne ($40,233, a difference of 0.37%), and Seminole ($40,233, a difference of 0.37%).
| Demographics | Rating | Rank | Median Earnings |
| Chippewa | 0.0 /100 | #312 | Tragic $40,287 |
| Choctaw | 0.0 /100 | #313 | Tragic $40,270 |
| Cheyenne | 0.0 /100 | #314 | Tragic $40,233 |
| Seminole | 0.0 /100 | #315 | Tragic $40,233 |
| Immigrants | Honduras | 0.0 /100 | #316 | Tragic $40,195 |
| Fijians | 0.0 /100 | #317 | Tragic $40,193 |
| Dutch West Indians | 0.0 /100 | #318 | Tragic $40,107 |
| Blacks/African Americans | 0.0 /100 | #319 | Tragic $40,085 |
| Immigrants | Bahamas | 0.0 /100 | #320 | Tragic $39,861 |
| Mexicans | 0.0 /100 | #321 | Tragic $39,834 |
| Immigrants | Central America | 0.0 /100 | #322 | Tragic $39,762 |
| Bahamians | 0.0 /100 | #323 | Tragic $39,735 |
| Ottawa | 0.0 /100 | #324 | Tragic $39,721 |
| Creek | 0.0 /100 | #325 | Tragic $39,648 |
| Immigrants | Yemen | 0.0 /100 | #326 | Tragic $39,540 |