Immigrants from Venezuela vs Tongan Unemployment Among Ages 35 to 44 years
COMPARE
Immigrants from Venezuela
Tongan
Unemployment Among Ages 35 to 44 years
Unemployment Among Ages 35 to 44 years Comparison
Immigrants from Venezuela
Tongans
4.0%
UNEMPLOYMENT AMONG AGES 35 TO 44 YEARS
100.0/ 100
METRIC RATING
6th/ 347
METRIC RANK
4.2%
UNEMPLOYMENT AMONG AGES 35 TO 44 YEARS
99.8/ 100
METRIC RATING
15th/ 347
METRIC RANK
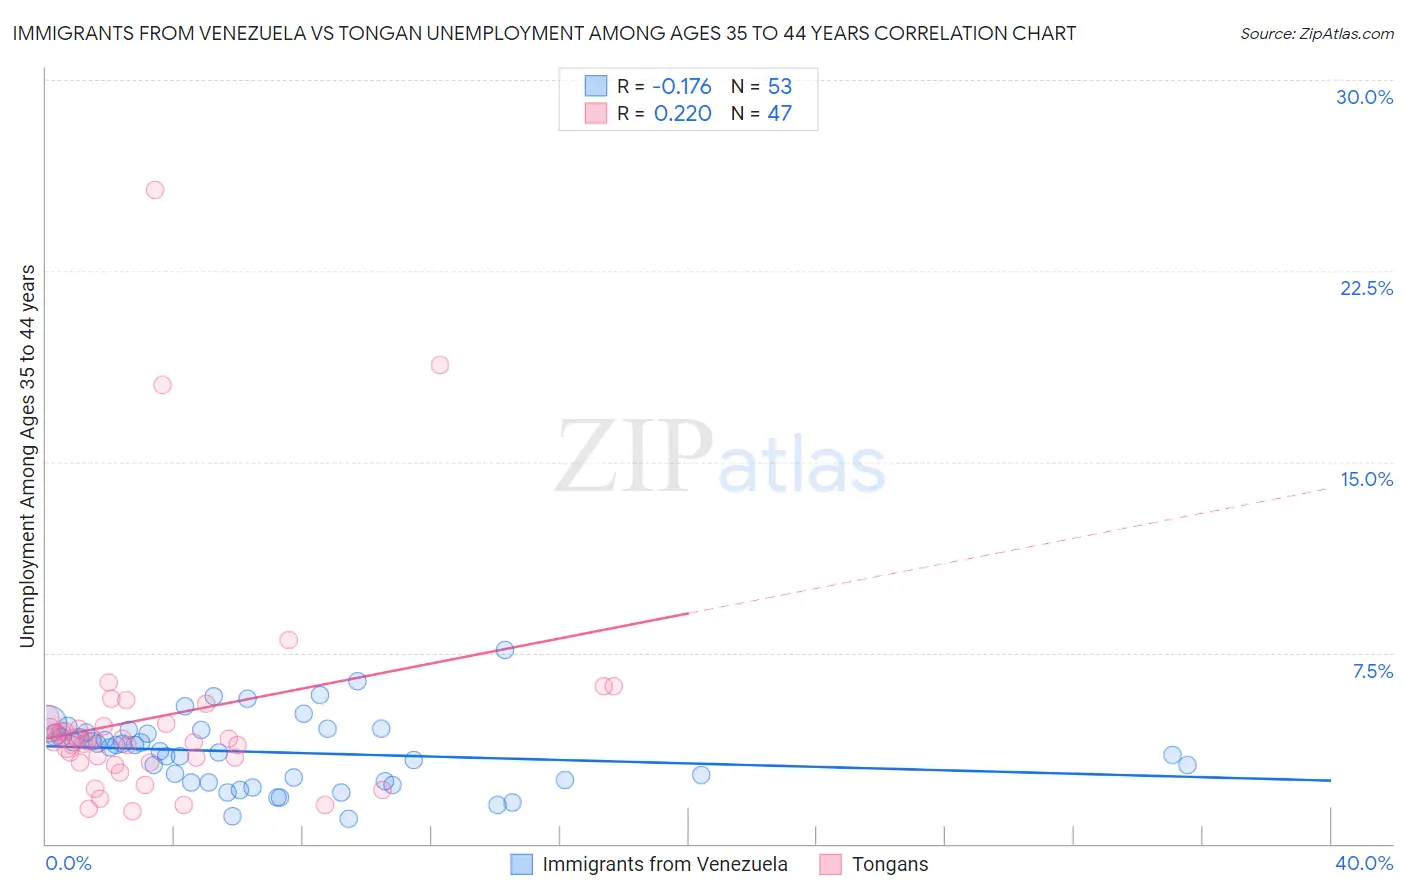
Immigrants from Venezuela vs Tongan Unemployment Among Ages 35 to 44 years Correlation Chart
The statistical analysis conducted on geographies consisting of 284,233,701 people shows a poor negative correlation between the proportion of Immigrants from Venezuela and unemployment rate among population between the ages 35 and 44 in the United States with a correlation coefficient (R) of -0.176 and weighted average of 4.0%. Similarly, the statistical analysis conducted on geographies consisting of 102,138,894 people shows a weak positive correlation between the proportion of Tongans and unemployment rate among population between the ages 35 and 44 in the United States with a correlation coefficient (R) of 0.220 and weighted average of 4.2%, a difference of 2.5%.
Unemployment Among Ages 35 to 44 years Correlation Summary
| Measurement | Immigrants from Venezuela | Tongan |
| Minimum | 1.0% | 1.3% |
| Maximum | 7.6% | 25.7% |
| Range | 6.6% | 24.4% |
| Mean | 3.6% | 5.0% |
| Median | 3.8% | 4.0% |
| Interquartile 25% (IQ1) | 2.4% | 3.2% |
| Interquartile 75% (IQ3) | 4.4% | 4.7% |
| Interquartile Range (IQR) | 2.0% | 1.5% |
| Standard Deviation (Sample) | 1.4% | 4.5% |
| Standard Deviation (Population) | 1.4% | 4.4% |
Demographics Similar to Immigrants from Venezuela and Tongans by Unemployment Among Ages 35 to 44 years
In terms of unemployment among ages 35 to 44 years, the demographic groups most similar to Immigrants from Venezuela are Filipino (4.0%, a difference of 0.090%), Immigrants from Taiwan (4.0%, a difference of 0.75%), Immigrants from Cuba (4.1%, a difference of 0.81%), Norwegian (4.0%, a difference of 1.3%), and Immigrants from South Central Asia (4.1%, a difference of 1.4%). Similarly, the demographic groups most similar to Tongans are Czech (4.1%, a difference of 0.080%), Bolivian (4.1%, a difference of 0.18%), Venezuelan (4.1%, a difference of 0.23%), Sudanese (4.1%, a difference of 0.33%), and Immigrants from Singapore (4.1%, a difference of 0.39%).
| Demographics | Rating | Rank | Unemployment Among Ages 35 to 44 years |
| Immigrants | India | 100.0 /100 | #1 | Exceptional 3.8% |
| Thais | 100.0 /100 | #2 | Exceptional 3.9% |
| Norwegians | 100.0 /100 | #3 | Exceptional 4.0% |
| Immigrants | Taiwan | 100.0 /100 | #4 | Exceptional 4.0% |
| Filipinos | 100.0 /100 | #5 | Exceptional 4.0% |
| Immigrants | Venezuela | 100.0 /100 | #6 | Exceptional 4.0% |
| Immigrants | Cuba | 99.9 /100 | #7 | Exceptional 4.1% |
| Immigrants | South Central Asia | 99.9 /100 | #8 | Exceptional 4.1% |
| Danes | 99.9 /100 | #9 | Exceptional 4.1% |
| Immigrants | Singapore | 99.9 /100 | #10 | Exceptional 4.1% |
| Sudanese | 99.9 /100 | #11 | Exceptional 4.1% |
| Venezuelans | 99.9 /100 | #12 | Exceptional 4.1% |
| Bolivians | 99.9 /100 | #13 | Exceptional 4.1% |
| Czechs | 99.9 /100 | #14 | Exceptional 4.1% |
| Tongans | 99.8 /100 | #15 | Exceptional 4.2% |
| Cubans | 99.8 /100 | #16 | Exceptional 4.2% |
| Swedes | 99.8 /100 | #17 | Exceptional 4.2% |
| Latvians | 99.8 /100 | #18 | Exceptional 4.2% |
| Immigrants | Nepal | 99.7 /100 | #19 | Exceptional 4.2% |
| Immigrants | Bolivia | 99.7 /100 | #20 | Exceptional 4.2% |