Immigrants from Venezuela vs White/Caucasian Median Male Earnings
COMPARE
Immigrants from Venezuela
White/Caucasian
Median Male Earnings
Median Male Earnings Comparison
Immigrants from Venezuela
Whites/Caucasians
$52,041
MEDIAN MALE EARNINGS
8.3/ 100
METRIC RATING
216th/ 347
METRIC RANK
$53,925
MEDIAN MALE EARNINGS
36.5/ 100
METRIC RATING
184th/ 347
METRIC RANK
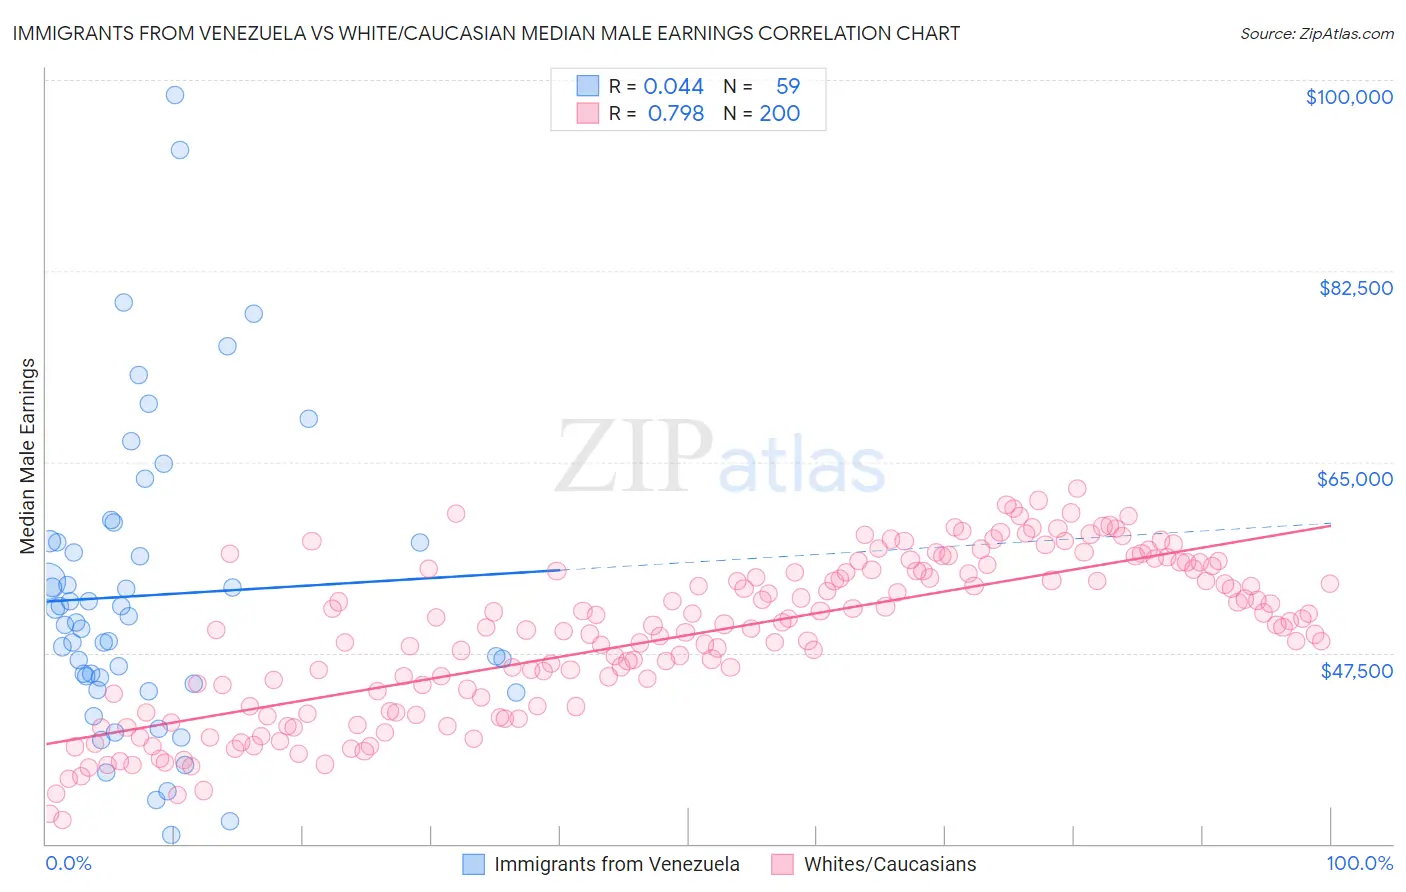
Immigrants from Venezuela vs White/Caucasian Median Male Earnings Correlation Chart
The statistical analysis conducted on geographies consisting of 287,825,740 people shows no correlation between the proportion of Immigrants from Venezuela and median male earnings in the United States with a correlation coefficient (R) of 0.044 and weighted average of $52,041. Similarly, the statistical analysis conducted on geographies consisting of 582,594,178 people shows a strong positive correlation between the proportion of Whites/Caucasians and median male earnings in the United States with a correlation coefficient (R) of 0.798 and weighted average of $53,925, a difference of 3.6%.
Median Male Earnings Correlation Summary
| Measurement | Immigrants from Venezuela | White/Caucasian |
| Minimum | $30,787 | $32,128 |
| Maximum | $98,656 | $62,517 |
| Range | $67,869 | $30,389 |
| Mean | $52,768 | $49,142 |
| Median | $50,259 | $50,057 |
| Interquartile 25% (IQ1) | $44,609 | $42,596 |
| Interquartile 75% (IQ3) | $57,648 | $55,134 |
| Interquartile Range (IQR) | $13,039 | $12,539 |
| Standard Deviation (Sample) | $13,735 | $7,259 |
| Standard Deviation (Population) | $13,618 | $7,240 |
Similar Demographics by Median Male Earnings
Demographics Similar to Immigrants from Venezuela by Median Male Earnings
In terms of median male earnings, the demographic groups most similar to Immigrants from Venezuela are Nigerian ($52,039, a difference of 0.0%), Immigrants from Cameroon ($52,119, a difference of 0.15%), Immigrants from Panama ($51,962, a difference of 0.15%), Nonimmigrants ($52,170, a difference of 0.25%), and Immigrants from Ghana ($51,836, a difference of 0.40%).
| Demographics | Rating | Rank | Median Male Earnings |
| Bermudans | 12.1 /100 | #209 | Poor $52,465 |
| Delaware | 11.5 /100 | #210 | Poor $52,412 |
| Tlingit-Haida | 11.5 /100 | #211 | Poor $52,409 |
| Cajuns | 10.7 /100 | #212 | Poor $52,325 |
| Native Hawaiians | 10.5 /100 | #213 | Poor $52,306 |
| Immigrants | Nonimmigrants | 9.3 /100 | #214 | Tragic $52,170 |
| Immigrants | Cameroon | 8.9 /100 | #215 | Tragic $52,119 |
| Immigrants | Venezuela | 8.3 /100 | #216 | Tragic $52,041 |
| Nigerians | 8.3 /100 | #217 | Tragic $52,039 |
| Immigrants | Panama | 7.7 /100 | #218 | Tragic $51,962 |
| Immigrants | Ghana | 6.9 /100 | #219 | Tragic $51,836 |
| Immigrants | Armenia | 6.6 /100 | #220 | Tragic $51,793 |
| Immigrants | Senegal | 5.8 /100 | #221 | Tragic $51,647 |
| Immigrants | Bangladesh | 5.8 /100 | #222 | Tragic $51,642 |
| Ecuadorians | 5.5 /100 | #223 | Tragic $51,596 |
Demographics Similar to Whites/Caucasians by Median Male Earnings
In terms of median male earnings, the demographic groups most similar to Whites/Caucasians are Immigrants from Sierra Leone ($53,905, a difference of 0.040%), Immigrants from South America ($53,962, a difference of 0.070%), Yugoslavian ($53,967, a difference of 0.080%), Colombian ($53,832, a difference of 0.17%), and Immigrants from Eritrea ($53,715, a difference of 0.39%).
| Demographics | Rating | Rank | Median Male Earnings |
| Costa Ricans | 44.8 /100 | #177 | Average $54,279 |
| Sierra Leoneans | 44.8 /100 | #178 | Average $54,279 |
| Celtics | 43.9 /100 | #179 | Average $54,242 |
| Iraqis | 42.5 /100 | #180 | Average $54,182 |
| Immigrants | Immigrants | 42.1 /100 | #181 | Average $54,168 |
| Yugoslavians | 37.4 /100 | #182 | Fair $53,967 |
| Immigrants | South America | 37.3 /100 | #183 | Fair $53,962 |
| Whites/Caucasians | 36.5 /100 | #184 | Fair $53,925 |
| Immigrants | Sierra Leone | 36.0 /100 | #185 | Fair $53,905 |
| Colombians | 34.4 /100 | #186 | Fair $53,832 |
| Immigrants | Eritrea | 31.8 /100 | #187 | Fair $53,715 |
| Immigrants | Eastern Africa | 31.8 /100 | #188 | Fair $53,713 |
| Puget Sound Salish | 31.6 /100 | #189 | Fair $53,704 |
| Uruguayans | 31.1 /100 | #190 | Fair $53,680 |
| Guamanians/Chamorros | 30.7 /100 | #191 | Fair $53,661 |