Immigrants from Venezuela vs Barbadian Median Male Earnings
COMPARE
Immigrants from Venezuela
Barbadian
Median Male Earnings
Median Male Earnings Comparison
Immigrants from Venezuela
Barbadians
$52,041
MEDIAN MALE EARNINGS
8.3/ 100
METRIC RATING
216th/ 347
METRIC RANK
$51,236
MEDIAN MALE EARNINGS
3.9/ 100
METRIC RATING
231st/ 347
METRIC RANK
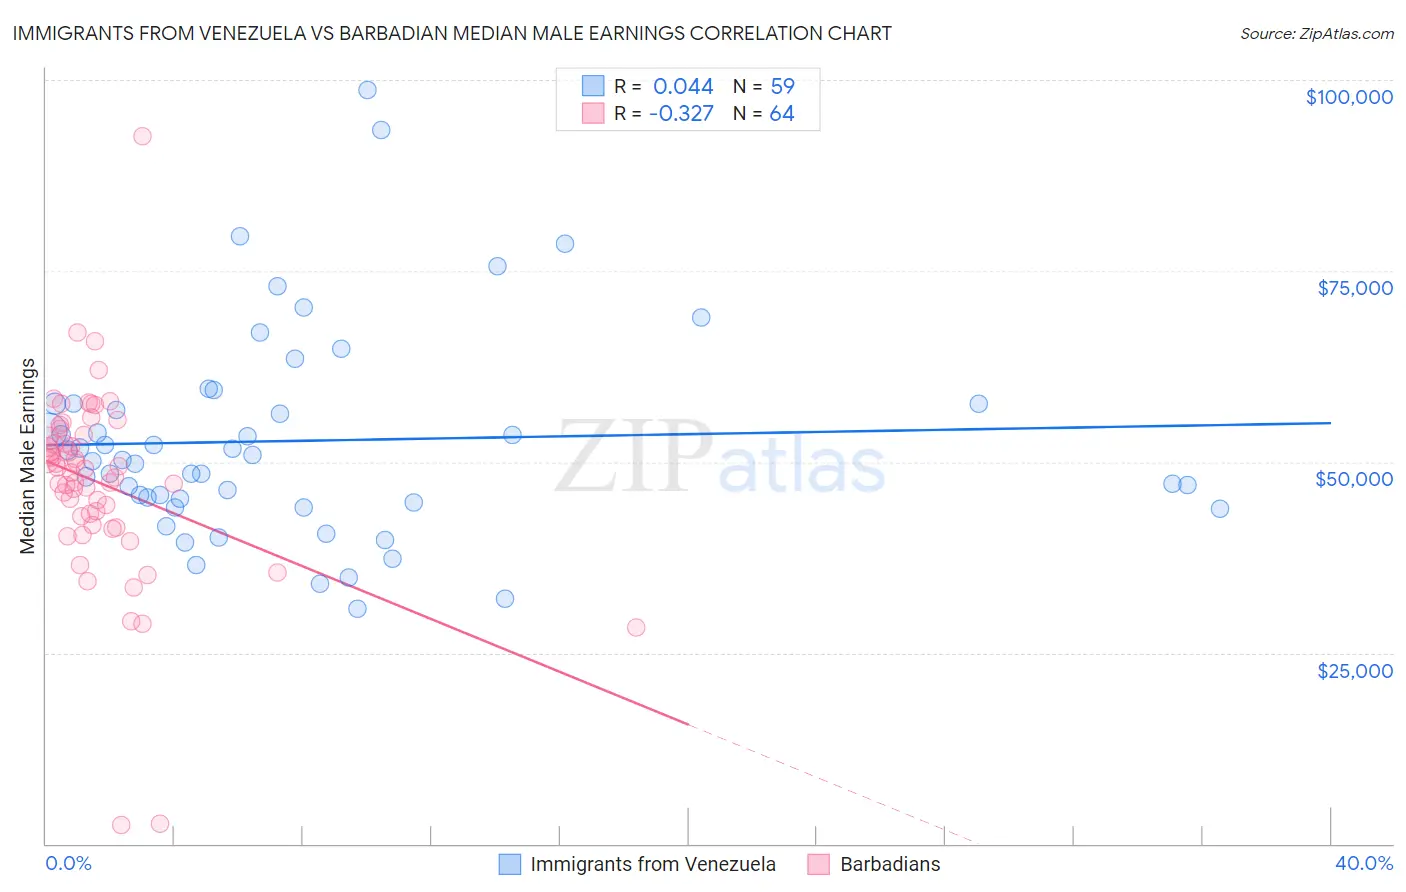
Immigrants from Venezuela vs Barbadian Median Male Earnings Correlation Chart
The statistical analysis conducted on geographies consisting of 287,825,740 people shows no correlation between the proportion of Immigrants from Venezuela and median male earnings in the United States with a correlation coefficient (R) of 0.044 and weighted average of $52,041. Similarly, the statistical analysis conducted on geographies consisting of 141,271,676 people shows a mild negative correlation between the proportion of Barbadians and median male earnings in the United States with a correlation coefficient (R) of -0.327 and weighted average of $51,236, a difference of 1.6%.
Median Male Earnings Correlation Summary
| Measurement | Immigrants from Venezuela | Barbadian |
| Minimum | $30,787 | $2,499 |
| Maximum | $98,656 | $92,582 |
| Range | $67,869 | $90,083 |
| Mean | $52,768 | $47,251 |
| Median | $50,259 | $48,821 |
| Interquartile 25% (IQ1) | $44,609 | $42,256 |
| Interquartile 75% (IQ3) | $57,648 | $53,422 |
| Interquartile Range (IQR) | $13,039 | $11,166 |
| Standard Deviation (Sample) | $13,735 | $12,825 |
| Standard Deviation (Population) | $13,618 | $12,724 |
Demographics Similar to Immigrants from Venezuela and Barbadians by Median Male Earnings
In terms of median male earnings, the demographic groups most similar to Immigrants from Venezuela are Nigerian ($52,039, a difference of 0.0%), Immigrants from Cameroon ($52,119, a difference of 0.15%), Immigrants from Panama ($51,962, a difference of 0.15%), Nonimmigrants ($52,170, a difference of 0.25%), and Immigrants from Ghana ($51,836, a difference of 0.40%). Similarly, the demographic groups most similar to Barbadians are Sudanese ($51,216, a difference of 0.040%), Aleut ($51,168, a difference of 0.13%), Immigrants from Nigeria ($51,310, a difference of 0.14%), Immigrants from Trinidad and Tobago ($51,376, a difference of 0.27%), and Samoan ($51,389, a difference of 0.30%).
| Demographics | Rating | Rank | Median Male Earnings |
| Native Hawaiians | 10.5 /100 | #213 | Poor $52,306 |
| Immigrants | Nonimmigrants | 9.3 /100 | #214 | Tragic $52,170 |
| Immigrants | Cameroon | 8.9 /100 | #215 | Tragic $52,119 |
| Immigrants | Venezuela | 8.3 /100 | #216 | Tragic $52,041 |
| Nigerians | 8.3 /100 | #217 | Tragic $52,039 |
| Immigrants | Panama | 7.7 /100 | #218 | Tragic $51,962 |
| Immigrants | Ghana | 6.9 /100 | #219 | Tragic $51,836 |
| Immigrants | Armenia | 6.6 /100 | #220 | Tragic $51,793 |
| Immigrants | Senegal | 5.8 /100 | #221 | Tragic $51,647 |
| Immigrants | Bangladesh | 5.8 /100 | #222 | Tragic $51,642 |
| Ecuadorians | 5.5 /100 | #223 | Tragic $51,596 |
| Immigrants | Cambodia | 5.5 /100 | #224 | Tragic $51,594 |
| Immigrants | Sudan | 5.0 /100 | #225 | Tragic $51,489 |
| Japanese | 4.9 /100 | #226 | Tragic $51,473 |
| Trinidadians and Tobagonians | 4.8 /100 | #227 | Tragic $51,446 |
| Samoans | 4.6 /100 | #228 | Tragic $51,389 |
| Immigrants | Trinidad and Tobago | 4.5 /100 | #229 | Tragic $51,376 |
| Immigrants | Nigeria | 4.2 /100 | #230 | Tragic $51,310 |
| Barbadians | 3.9 /100 | #231 | Tragic $51,236 |
| Sudanese | 3.9 /100 | #232 | Tragic $51,216 |
| Aleuts | 3.7 /100 | #233 | Tragic $51,168 |