Immigrants from Venezuela vs French Median Male Earnings
COMPARE
Immigrants from Venezuela
French
Median Male Earnings
Median Male Earnings Comparison
Immigrants from Venezuela
French
$52,041
MEDIAN MALE EARNINGS
8.3/ 100
METRIC RATING
216th/ 347
METRIC RANK
$55,350
MEDIAN MALE EARNINGS
69.9/ 100
METRIC RATING
162nd/ 347
METRIC RANK
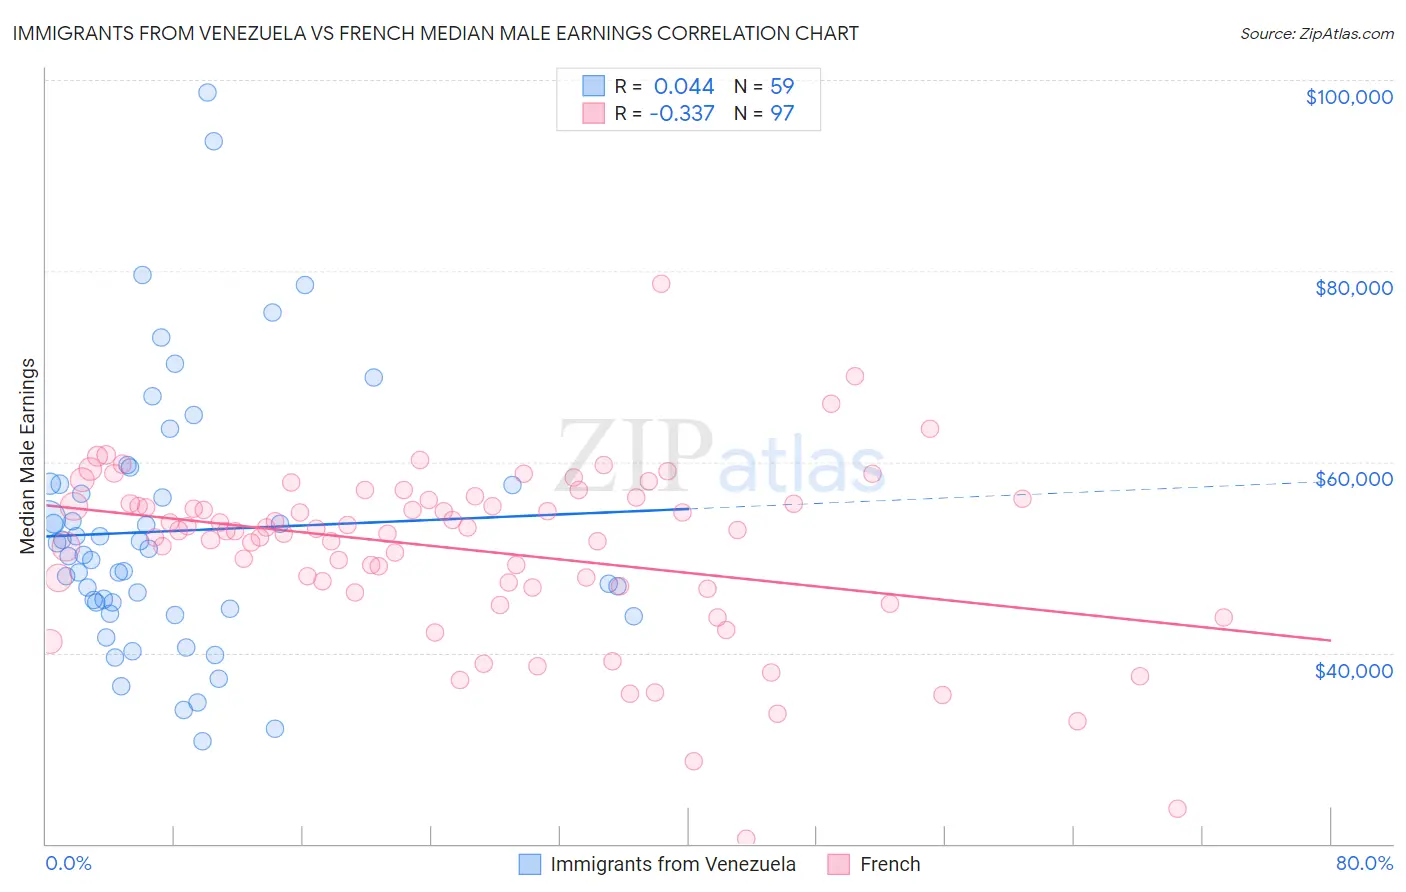
Immigrants from Venezuela vs French Median Male Earnings Correlation Chart
The statistical analysis conducted on geographies consisting of 287,825,740 people shows no correlation between the proportion of Immigrants from Venezuela and median male earnings in the United States with a correlation coefficient (R) of 0.044 and weighted average of $52,041. Similarly, the statistical analysis conducted on geographies consisting of 571,095,815 people shows a mild negative correlation between the proportion of French and median male earnings in the United States with a correlation coefficient (R) of -0.337 and weighted average of $55,350, a difference of 6.4%.
Median Male Earnings Correlation Summary
| Measurement | Immigrants from Venezuela | French |
| Minimum | $30,787 | $20,556 |
| Maximum | $98,656 | $78,663 |
| Range | $67,869 | $58,107 |
| Mean | $52,768 | $50,816 |
| Median | $50,259 | $52,806 |
| Interquartile 25% (IQ1) | $44,609 | $46,933 |
| Interquartile 75% (IQ3) | $57,648 | $56,096 |
| Interquartile Range (IQR) | $13,039 | $9,162 |
| Standard Deviation (Sample) | $13,735 | $9,122 |
| Standard Deviation (Population) | $13,618 | $9,075 |
Similar Demographics by Median Male Earnings
Demographics Similar to Immigrants from Venezuela by Median Male Earnings
In terms of median male earnings, the demographic groups most similar to Immigrants from Venezuela are Nigerian ($52,039, a difference of 0.0%), Immigrants from Cameroon ($52,119, a difference of 0.15%), Immigrants from Panama ($51,962, a difference of 0.15%), Nonimmigrants ($52,170, a difference of 0.25%), and Immigrants from Ghana ($51,836, a difference of 0.40%).
| Demographics | Rating | Rank | Median Male Earnings |
| Bermudans | 12.1 /100 | #209 | Poor $52,465 |
| Delaware | 11.5 /100 | #210 | Poor $52,412 |
| Tlingit-Haida | 11.5 /100 | #211 | Poor $52,409 |
| Cajuns | 10.7 /100 | #212 | Poor $52,325 |
| Native Hawaiians | 10.5 /100 | #213 | Poor $52,306 |
| Immigrants | Nonimmigrants | 9.3 /100 | #214 | Tragic $52,170 |
| Immigrants | Cameroon | 8.9 /100 | #215 | Tragic $52,119 |
| Immigrants | Venezuela | 8.3 /100 | #216 | Tragic $52,041 |
| Nigerians | 8.3 /100 | #217 | Tragic $52,039 |
| Immigrants | Panama | 7.7 /100 | #218 | Tragic $51,962 |
| Immigrants | Ghana | 6.9 /100 | #219 | Tragic $51,836 |
| Immigrants | Armenia | 6.6 /100 | #220 | Tragic $51,793 |
| Immigrants | Senegal | 5.8 /100 | #221 | Tragic $51,647 |
| Immigrants | Bangladesh | 5.8 /100 | #222 | Tragic $51,642 |
| Ecuadorians | 5.5 /100 | #223 | Tragic $51,596 |
Demographics Similar to French by Median Male Earnings
In terms of median male earnings, the demographic groups most similar to French are Belgian ($55,361, a difference of 0.020%), Basque ($55,370, a difference of 0.040%), Alsatian ($55,380, a difference of 0.050%), Czechoslovakian ($55,382, a difference of 0.060%), and Ugandan ($55,290, a difference of 0.11%).
| Demographics | Rating | Rank | Median Male Earnings |
| Scandinavians | 73.4 /100 | #155 | Good $55,527 |
| Immigrants | Ethiopia | 71.6 /100 | #156 | Good $55,434 |
| Icelanders | 71.2 /100 | #157 | Good $55,415 |
| Czechoslovakians | 70.5 /100 | #158 | Good $55,382 |
| Alsatians | 70.5 /100 | #159 | Good $55,380 |
| Basques | 70.3 /100 | #160 | Good $55,370 |
| Belgians | 70.1 /100 | #161 | Good $55,361 |
| French | 69.9 /100 | #162 | Good $55,350 |
| Ugandans | 68.6 /100 | #163 | Good $55,290 |
| Immigrants | South Eastern Asia | 67.6 /100 | #164 | Good $55,241 |
| Immigrants | Portugal | 66.3 /100 | #165 | Good $55,182 |
| Germans | 61.6 /100 | #166 | Good $54,974 |
| Immigrants | Fiji | 61.2 /100 | #167 | Good $54,958 |
| Immigrants | Vietnam | 60.2 /100 | #168 | Good $54,913 |
| French Canadians | 55.6 /100 | #169 | Average $54,722 |