Immigrants from Venezuela vs Tlingit-Haida Householder Income Ages 45 - 64 years
COMPARE
Immigrants from Venezuela
Tlingit-Haida
Householder Income Ages 45 - 64 years
Householder Income Ages 45 - 64 years Comparison
Immigrants from Venezuela
Tlingit-Haida
$95,342
HOUSEHOLDER INCOME AGES 45 - 64 YEARS
7.6/ 100
METRIC RATING
216th/ 347
METRIC RANK
$97,417
HOUSEHOLDER INCOME AGES 45 - 64 YEARS
18.9/ 100
METRIC RATING
202nd/ 347
METRIC RANK
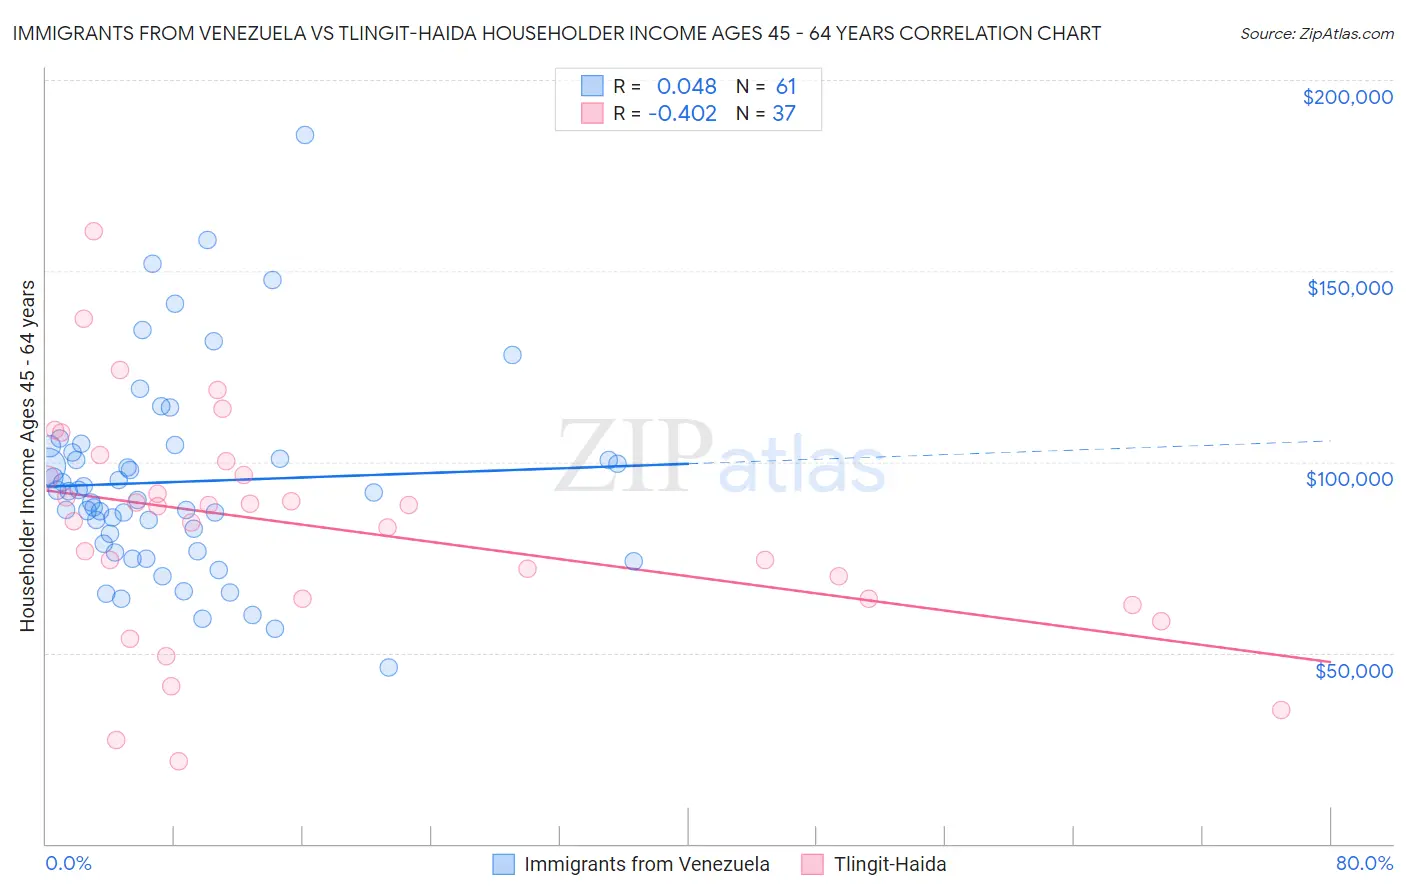
Immigrants from Venezuela vs Tlingit-Haida Householder Income Ages 45 - 64 years Correlation Chart
The statistical analysis conducted on geographies consisting of 287,624,834 people shows no correlation between the proportion of Immigrants from Venezuela and household income with householder between the ages 45 and 64 in the United States with a correlation coefficient (R) of 0.048 and weighted average of $95,342. Similarly, the statistical analysis conducted on geographies consisting of 60,826,750 people shows a moderate negative correlation between the proportion of Tlingit-Haida and household income with householder between the ages 45 and 64 in the United States with a correlation coefficient (R) of -0.402 and weighted average of $97,417, a difference of 2.2%.
Householder Income Ages 45 - 64 years Correlation Summary
| Measurement | Immigrants from Venezuela | Tlingit-Haida |
| Minimum | $46,250 | $21,563 |
| Maximum | $185,667 | $160,485 |
| Range | $139,417 | $138,922 |
| Mean | $94,774 | $83,137 |
| Median | $91,875 | $88,264 |
| Interquartile 25% (IQ1) | $77,515 | $64,077 |
| Interquartile 75% (IQ3) | $103,326 | $98,405 |
| Interquartile Range (IQR) | $25,811 | $34,328 |
| Standard Deviation (Sample) | $26,075 | $29,197 |
| Standard Deviation (Population) | $25,861 | $28,800 |
Demographics Similar to Immigrants from Venezuela and Tlingit-Haida by Householder Income Ages 45 - 64 years
In terms of householder income ages 45 - 64 years, the demographic groups most similar to Immigrants from Venezuela are Nigerian ($95,492, a difference of 0.16%), Immigrants from Ghana ($94,982, a difference of 0.38%), Delaware ($94,914, a difference of 0.45%), Immigrants from Armenia ($94,863, a difference of 0.50%), and Panamanian ($96,066, a difference of 0.76%). Similarly, the demographic groups most similar to Tlingit-Haida are Immigrants from Thailand ($97,400, a difference of 0.020%), Immigrants from Eritrea ($97,373, a difference of 0.040%), Immigrants from Colombia ($97,290, a difference of 0.13%), Immigrants from Africa ($97,284, a difference of 0.14%), and Ghanaian ($97,277, a difference of 0.14%).
| Demographics | Rating | Rank | Householder Income Ages 45 - 64 years |
| Whites/Caucasians | 24.6 /100 | #199 | Fair $98,091 |
| Immigrants | Kenya | 23.5 /100 | #200 | Fair $97,964 |
| Yugoslavians | 20.0 /100 | #201 | Fair $97,558 |
| Tlingit-Haida | 18.9 /100 | #202 | Poor $97,417 |
| Immigrants | Thailand | 18.8 /100 | #203 | Poor $97,400 |
| Immigrants | Eritrea | 18.6 /100 | #204 | Poor $97,373 |
| Immigrants | Colombia | 18.0 /100 | #205 | Poor $97,290 |
| Immigrants | Africa | 17.9 /100 | #206 | Poor $97,284 |
| Ghanaians | 17.9 /100 | #207 | Poor $97,277 |
| Scotch-Irish | 16.4 /100 | #208 | Poor $97,073 |
| Japanese | 14.8 /100 | #209 | Poor $96,834 |
| Tsimshian | 14.5 /100 | #210 | Poor $96,783 |
| Immigrants | Cambodia | 13.0 /100 | #211 | Poor $96,537 |
| Venezuelans | 12.6 /100 | #212 | Poor $96,460 |
| Immigrants | Uruguay | 10.7 /100 | #213 | Poor $96,086 |
| Panamanians | 10.6 /100 | #214 | Poor $96,066 |
| Nigerians | 8.2 /100 | #215 | Tragic $95,492 |
| Immigrants | Venezuela | 7.6 /100 | #216 | Tragic $95,342 |
| Immigrants | Ghana | 6.4 /100 | #217 | Tragic $94,982 |
| Delaware | 6.2 /100 | #218 | Tragic $94,914 |
| Immigrants | Armenia | 6.1 /100 | #219 | Tragic $94,863 |