Immigrants from Venezuela vs Immigrants from Kenya Householder Income Ages 45 - 64 years
COMPARE
Immigrants from Venezuela
Immigrants from Kenya
Householder Income Ages 45 - 64 years
Householder Income Ages 45 - 64 years Comparison
Immigrants from Venezuela
Immigrants from Kenya
$95,342
HOUSEHOLDER INCOME AGES 45 - 64 YEARS
7.6/ 100
METRIC RATING
216th/ 347
METRIC RANK
$97,964
HOUSEHOLDER INCOME AGES 45 - 64 YEARS
23.5/ 100
METRIC RATING
200th/ 347
METRIC RANK
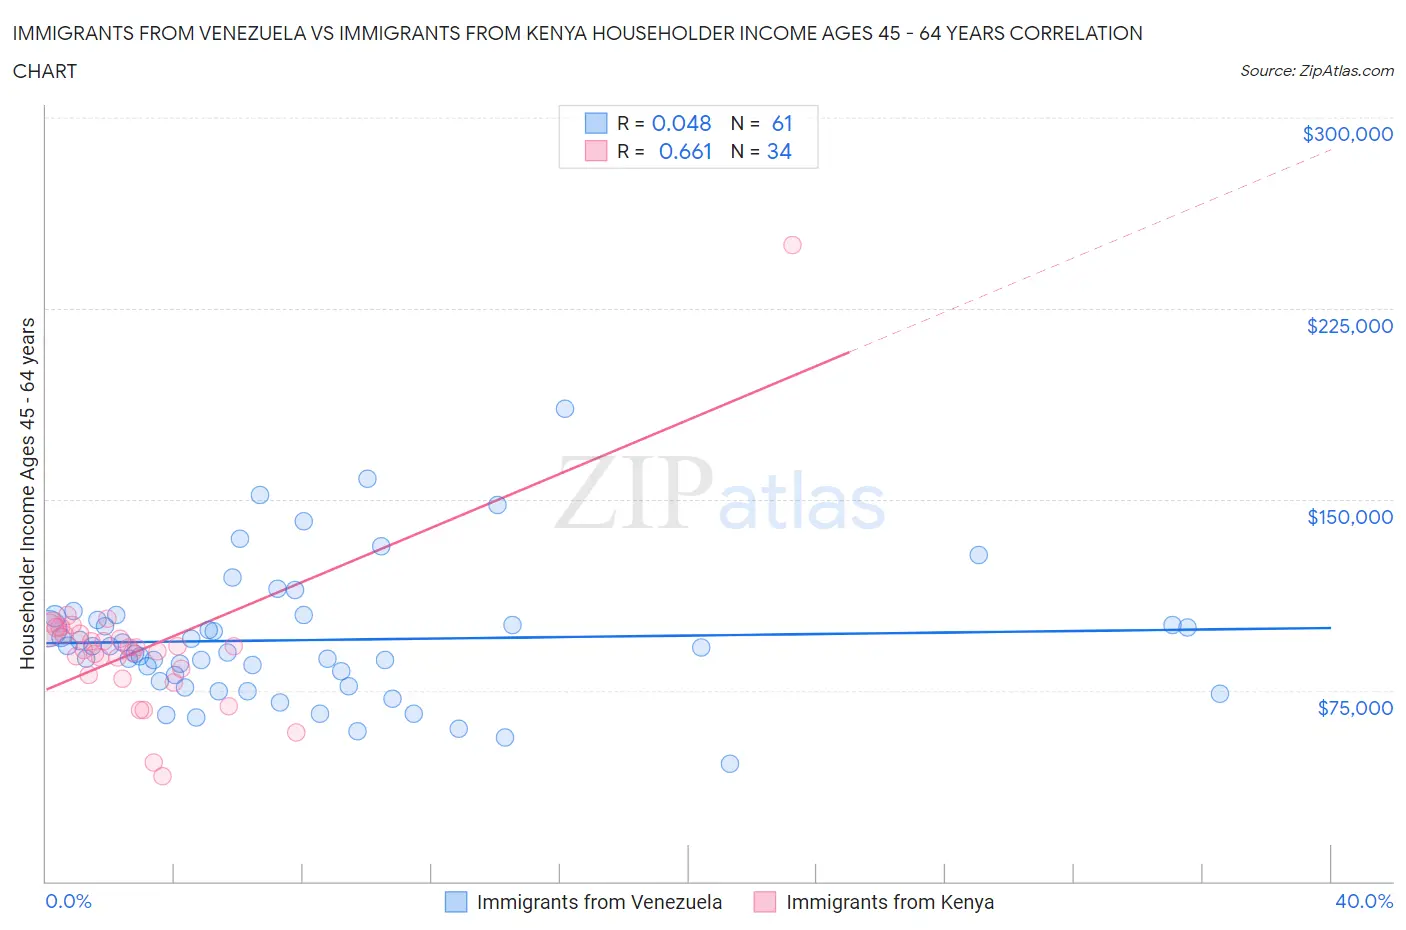
Immigrants from Venezuela vs Immigrants from Kenya Householder Income Ages 45 - 64 years Correlation Chart
The statistical analysis conducted on geographies consisting of 287,624,834 people shows no correlation between the proportion of Immigrants from Venezuela and household income with householder between the ages 45 and 64 in the United States with a correlation coefficient (R) of 0.048 and weighted average of $95,342. Similarly, the statistical analysis conducted on geographies consisting of 217,894,820 people shows a significant positive correlation between the proportion of Immigrants from Kenya and household income with householder between the ages 45 and 64 in the United States with a correlation coefficient (R) of 0.661 and weighted average of $97,964, a difference of 2.8%.
Householder Income Ages 45 - 64 years Correlation Summary
| Measurement | Immigrants from Venezuela | Immigrants from Kenya |
| Minimum | $46,250 | $41,343 |
| Maximum | $185,667 | $250,001 |
| Range | $139,417 | $208,658 |
| Mean | $94,774 | $91,195 |
| Median | $91,875 | $91,314 |
| Interquartile 25% (IQ1) | $77,515 | $80,833 |
| Interquartile 75% (IQ3) | $103,326 | $97,063 |
| Interquartile Range (IQR) | $25,811 | $16,231 |
| Standard Deviation (Sample) | $26,075 | $31,961 |
| Standard Deviation (Population) | $25,861 | $31,487 |
Demographics Similar to Immigrants from Venezuela and Immigrants from Kenya by Householder Income Ages 45 - 64 years
In terms of householder income ages 45 - 64 years, the demographic groups most similar to Immigrants from Venezuela are Nigerian ($95,492, a difference of 0.16%), Immigrants from Ghana ($94,982, a difference of 0.38%), Delaware ($94,914, a difference of 0.45%), Panamanian ($96,066, a difference of 0.76%), and Immigrants from Uruguay ($96,086, a difference of 0.78%). Similarly, the demographic groups most similar to Immigrants from Kenya are White/Caucasian ($98,091, a difference of 0.13%), Immigrants from Iraq ($98,201, a difference of 0.24%), Yugoslavian ($97,558, a difference of 0.42%), Tlingit-Haida ($97,417, a difference of 0.56%), and Immigrants from Thailand ($97,400, a difference of 0.58%).
| Demographics | Rating | Rank | Householder Income Ages 45 - 64 years |
| Immigrants | Iraq | 25.7 /100 | #198 | Fair $98,201 |
| Whites/Caucasians | 24.6 /100 | #199 | Fair $98,091 |
| Immigrants | Kenya | 23.5 /100 | #200 | Fair $97,964 |
| Yugoslavians | 20.0 /100 | #201 | Fair $97,558 |
| Tlingit-Haida | 18.9 /100 | #202 | Poor $97,417 |
| Immigrants | Thailand | 18.8 /100 | #203 | Poor $97,400 |
| Immigrants | Eritrea | 18.6 /100 | #204 | Poor $97,373 |
| Immigrants | Colombia | 18.0 /100 | #205 | Poor $97,290 |
| Immigrants | Africa | 17.9 /100 | #206 | Poor $97,284 |
| Ghanaians | 17.9 /100 | #207 | Poor $97,277 |
| Scotch-Irish | 16.4 /100 | #208 | Poor $97,073 |
| Japanese | 14.8 /100 | #209 | Poor $96,834 |
| Tsimshian | 14.5 /100 | #210 | Poor $96,783 |
| Immigrants | Cambodia | 13.0 /100 | #211 | Poor $96,537 |
| Venezuelans | 12.6 /100 | #212 | Poor $96,460 |
| Immigrants | Uruguay | 10.7 /100 | #213 | Poor $96,086 |
| Panamanians | 10.6 /100 | #214 | Poor $96,066 |
| Nigerians | 8.2 /100 | #215 | Tragic $95,492 |
| Immigrants | Venezuela | 7.6 /100 | #216 | Tragic $95,342 |
| Immigrants | Ghana | 6.4 /100 | #217 | Tragic $94,982 |
| Delaware | 6.2 /100 | #218 | Tragic $94,914 |