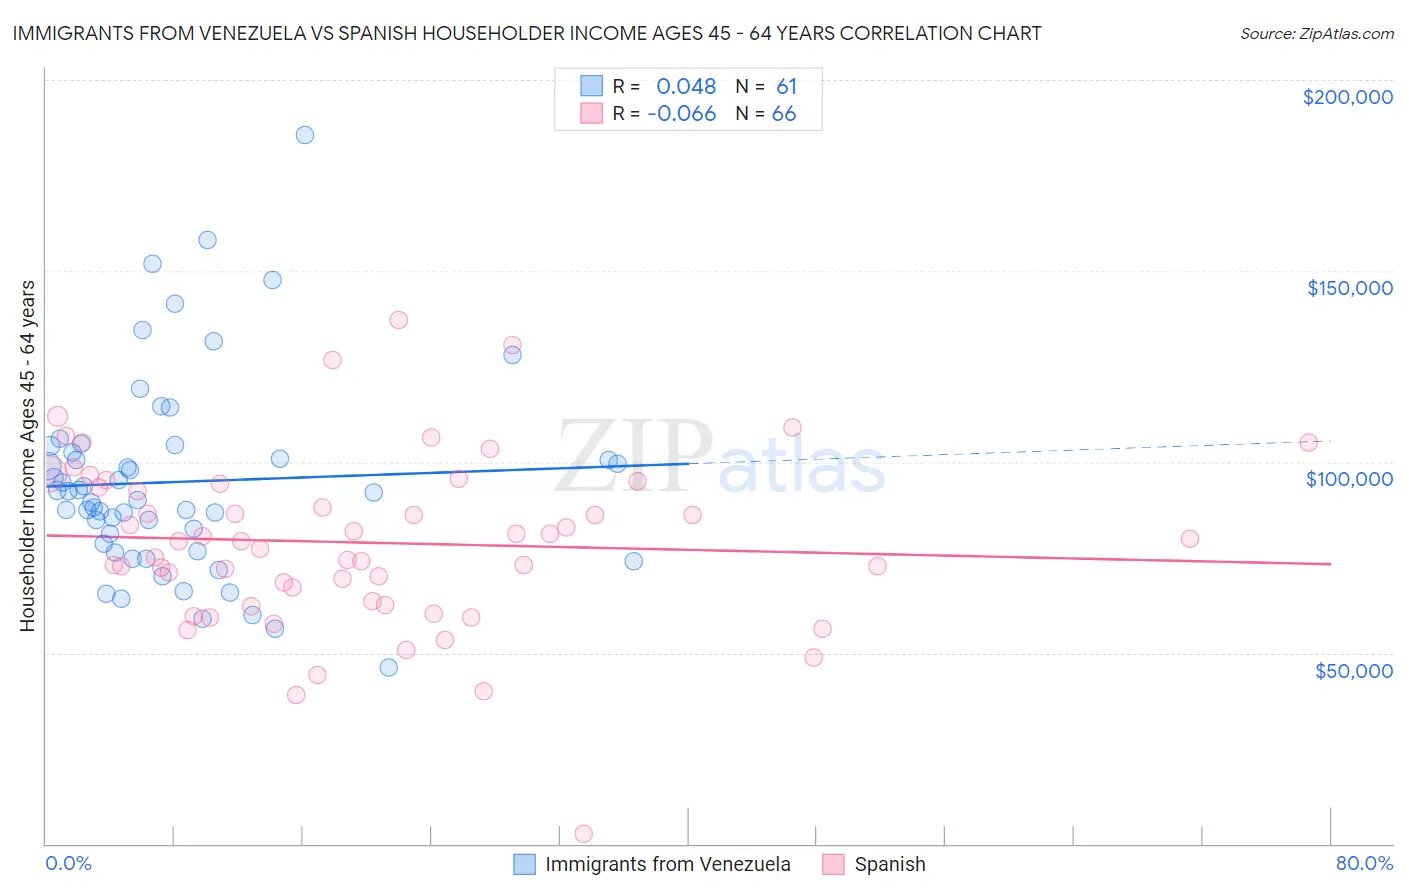
Immigrants from Venezuela vs Spanish Householder Income Ages 45 - 64 years
COMPARE
Immigrants from Venezuela
Spanish
Householder Income Ages 45 - 64 years
Householder Income Ages 45 - 64 years Comparison
Immigrants from Venezuela
Spanish
$95,342
HOUSEHOLDER INCOME AGES 45 - 64 YEARS
7.6/ 100
METRIC RATING
216th/ 347
METRIC RANK
$98,554
HOUSEHOLDER INCOME AGES 45 - 64 YEARS
29.2/ 100
METRIC RATING
195th/ 347
METRIC RANK
Immigrants from Venezuela vs Spanish Householder Income Ages 45 - 64 years Correlation Chart
The statistical analysis conducted on geographies consisting of 287,624,834 people shows no correlation between the proportion of Immigrants from Venezuela and household income with householder between the ages 45 and 64 in the United States with a correlation coefficient (R) of 0.048 and weighted average of $95,342. Similarly, the statistical analysis conducted on geographies consisting of 421,243,274 people shows a slight negative correlation between the proportion of Spanish and household income with householder between the ages 45 and 64 in the United States with a correlation coefficient (R) of -0.066 and weighted average of $98,554, a difference of 3.4%.
Householder Income Ages 45 - 64 years Correlation Summary
| Measurement | Immigrants from Venezuela | Spanish |
| Minimum | $46,250 | $2,499 |
| Maximum | $185,667 | $137,143 |
| Range | $139,417 | $134,644 |
| Mean | $94,774 | $78,857 |
| Median | $91,875 | $79,247 |
| Interquartile 25% (IQ1) | $77,515 | $63,421 |
| Interquartile 75% (IQ3) | $103,326 | $94,394 |
| Interquartile Range (IQR) | $25,811 | $30,972 |
| Standard Deviation (Sample) | $26,075 | $22,794 |
| Standard Deviation (Population) | $25,861 | $22,620 |
Similar Demographics by Householder Income Ages 45 - 64 years
Demographics Similar to Immigrants from Venezuela by Householder Income Ages 45 - 64 years
In terms of householder income ages 45 - 64 years, the demographic groups most similar to Immigrants from Venezuela are Nigerian ($95,492, a difference of 0.16%), Immigrants from Ghana ($94,982, a difference of 0.38%), Delaware ($94,914, a difference of 0.45%), Immigrants from Armenia ($94,863, a difference of 0.50%), and Salvadoran ($94,842, a difference of 0.53%).
| Demographics | Rating | Rank | Householder Income Ages 45 - 64 years |
| Japanese | 14.8 /100 | #209 | Poor $96,834 |
| Tsimshian | 14.5 /100 | #210 | Poor $96,783 |
| Immigrants | Cambodia | 13.0 /100 | #211 | Poor $96,537 |
| Venezuelans | 12.6 /100 | #212 | Poor $96,460 |
| Immigrants | Uruguay | 10.7 /100 | #213 | Poor $96,086 |
| Panamanians | 10.6 /100 | #214 | Poor $96,066 |
| Nigerians | 8.2 /100 | #215 | Tragic $95,492 |
| Immigrants | Venezuela | 7.6 /100 | #216 | Tragic $95,342 |
| Immigrants | Ghana | 6.4 /100 | #217 | Tragic $94,982 |
| Delaware | 6.2 /100 | #218 | Tragic $94,914 |
| Immigrants | Armenia | 6.1 /100 | #219 | Tragic $94,863 |
| Salvadorans | 6.0 /100 | #220 | Tragic $94,842 |
| Immigrants | Nigeria | 5.9 /100 | #221 | Tragic $94,804 |
| Malaysians | 5.2 /100 | #222 | Tragic $94,517 |
| Immigrants | Nonimmigrants | 5.0 /100 | #223 | Tragic $94,448 |
Demographics Similar to Spanish by Householder Income Ages 45 - 64 years
In terms of householder income ages 45 - 64 years, the demographic groups most similar to Spanish are Immigrants from Eastern Africa ($98,467, a difference of 0.090%), Uruguayan ($98,660, a difference of 0.11%), Puget Sound Salish ($98,340, a difference of 0.22%), Hawaiian ($98,778, a difference of 0.23%), and Celtic ($98,896, a difference of 0.35%).
| Demographics | Rating | Rank | Householder Income Ages 45 - 64 years |
| Immigrants | Portugal | 36.3 /100 | #188 | Fair $99,203 |
| Immigrants | South America | 35.4 /100 | #189 | Fair $99,126 |
| French Canadians | 35.1 /100 | #190 | Fair $99,093 |
| Kenyans | 33.7 /100 | #191 | Fair $98,970 |
| Celtics | 32.9 /100 | #192 | Fair $98,896 |
| Hawaiians | 31.6 /100 | #193 | Fair $98,778 |
| Uruguayans | 30.3 /100 | #194 | Fair $98,660 |
| Spanish | 29.2 /100 | #195 | Fair $98,554 |
| Immigrants | Eastern Africa | 28.3 /100 | #196 | Fair $98,467 |
| Puget Sound Salish | 27.0 /100 | #197 | Fair $98,340 |
| Immigrants | Iraq | 25.7 /100 | #198 | Fair $98,201 |
| Whites/Caucasians | 24.6 /100 | #199 | Fair $98,091 |
| Immigrants | Kenya | 23.5 /100 | #200 | Fair $97,964 |
| Yugoslavians | 20.0 /100 | #201 | Fair $97,558 |
| Tlingit-Haida | 18.9 /100 | #202 | Poor $97,417 |