Immigrants from Venezuela vs French Median Earnings
COMPARE
Immigrants from Venezuela
French
Median Earnings
Median Earnings Comparison
Immigrants from Venezuela
French
$44,163
MEDIAN EARNINGS
4.0/ 100
METRIC RATING
242nd/ 347
METRIC RANK
$46,296
MEDIAN EARNINGS
45.2/ 100
METRIC RATING
183rd/ 347
METRIC RANK
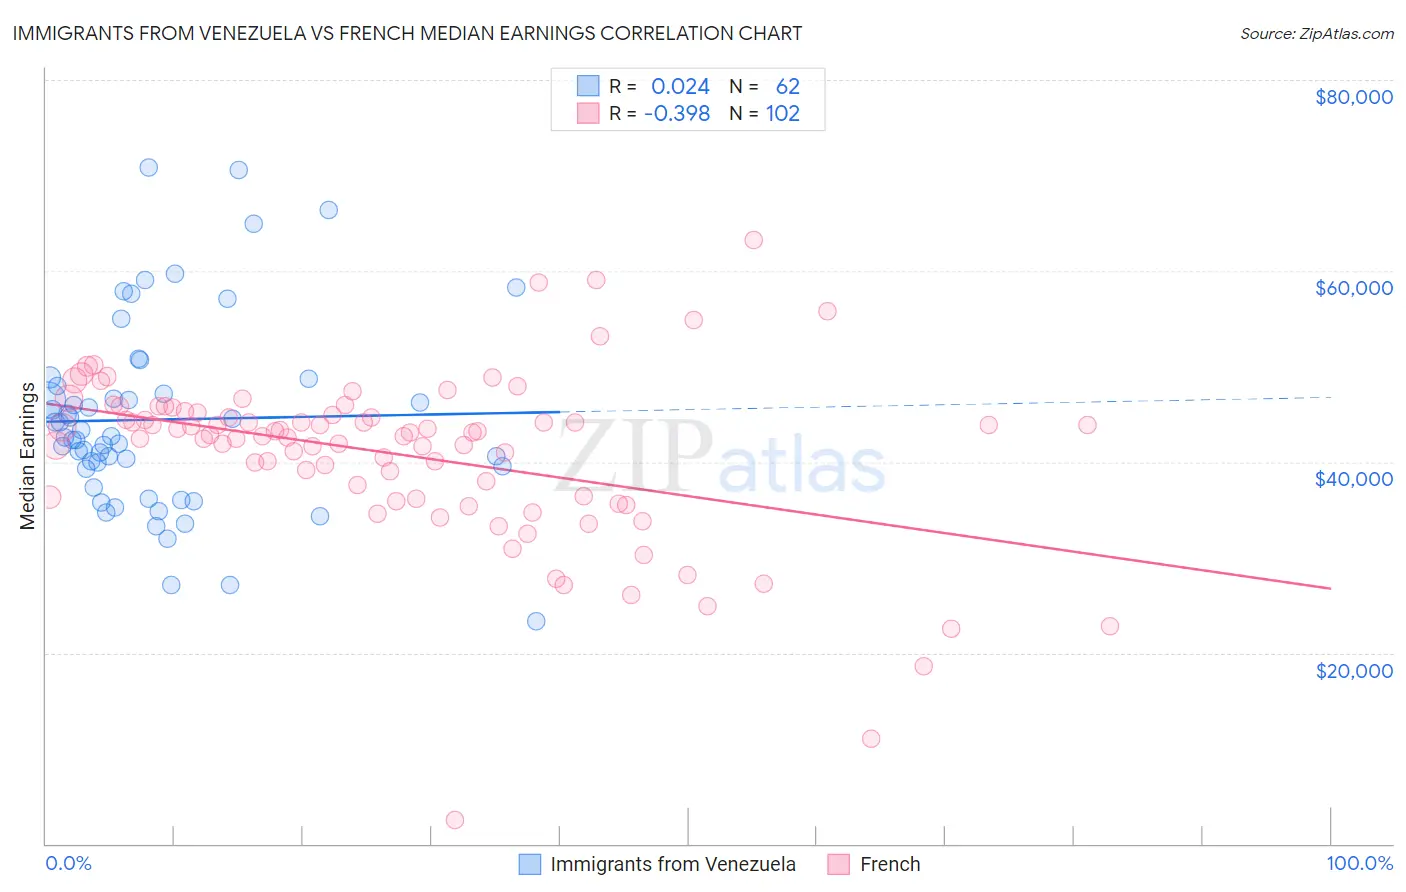
Immigrants from Venezuela vs French Median Earnings Correlation Chart
The statistical analysis conducted on geographies consisting of 287,839,546 people shows no correlation between the proportion of Immigrants from Venezuela and median earnings in the United States with a correlation coefficient (R) of 0.024 and weighted average of $44,163. Similarly, the statistical analysis conducted on geographies consisting of 572,035,046 people shows a mild negative correlation between the proportion of French and median earnings in the United States with a correlation coefficient (R) of -0.398 and weighted average of $46,296, a difference of 4.8%.
Median Earnings Correlation Summary
| Measurement | Immigrants from Venezuela | French |
| Minimum | $23,314 | $2,499 |
| Maximum | $70,871 | $63,271 |
| Range | $47,557 | $60,772 |
| Mean | $44,436 | $40,779 |
| Median | $42,584 | $42,886 |
| Interquartile 25% (IQ1) | $39,305 | $36,330 |
| Interquartile 75% (IQ3) | $47,920 | $45,125 |
| Interquartile Range (IQR) | $8,616 | $8,794 |
| Standard Deviation (Sample) | $9,975 | $9,085 |
| Standard Deviation (Population) | $9,895 | $9,040 |
Similar Demographics by Median Earnings
Demographics Similar to Immigrants from Venezuela by Median Earnings
In terms of median earnings, the demographic groups most similar to Immigrants from Venezuela are Samoan ($44,206, a difference of 0.10%), Subsaharan African ($44,118, a difference of 0.10%), Nonimmigrants ($44,117, a difference of 0.10%), Aleut ($44,241, a difference of 0.18%), and Immigrants from Burma/Myanmar ($43,998, a difference of 0.37%).
| Demographics | Rating | Rank | Median Earnings |
| Venezuelans | 6.9 /100 | #235 | Tragic $44,580 |
| British West Indians | 6.7 /100 | #236 | Tragic $44,552 |
| Immigrants | Ecuador | 5.9 /100 | #237 | Tragic $44,462 |
| Sudanese | 5.6 /100 | #238 | Tragic $44,419 |
| Senegalese | 5.3 /100 | #239 | Tragic $44,373 |
| Aleuts | 4.4 /100 | #240 | Tragic $44,241 |
| Samoans | 4.2 /100 | #241 | Tragic $44,206 |
| Immigrants | Venezuela | 4.0 /100 | #242 | Tragic $44,163 |
| Sub-Saharan Africans | 3.7 /100 | #243 | Tragic $44,118 |
| Immigrants | Nonimmigrants | 3.7 /100 | #244 | Tragic $44,117 |
| Immigrants | Burma/Myanmar | 3.2 /100 | #245 | Tragic $43,998 |
| Immigrants | West Indies | 3.1 /100 | #246 | Tragic $43,989 |
| Immigrants | Cabo Verde | 3.0 /100 | #247 | Tragic $43,963 |
| Nepalese | 2.6 /100 | #248 | Tragic $43,860 |
| Malaysians | 2.6 /100 | #249 | Tragic $43,844 |
Demographics Similar to French by Median Earnings
In terms of median earnings, the demographic groups most similar to French are Swiss ($46,315, a difference of 0.040%), Immigrants from Cameroon ($46,329, a difference of 0.070%), English ($46,334, a difference of 0.080%), Puget Sound Salish ($46,333, a difference of 0.080%), and Colombian ($46,349, a difference of 0.12%).
| Demographics | Rating | Rank | Median Earnings |
| Danes | 48.6 /100 | #176 | Average $46,392 |
| Belgians | 48.0 /100 | #177 | Average $46,375 |
| Colombians | 47.1 /100 | #178 | Average $46,349 |
| English | 46.5 /100 | #179 | Average $46,334 |
| Puget Sound Salish | 46.5 /100 | #180 | Average $46,333 |
| Immigrants | Cameroon | 46.4 /100 | #181 | Average $46,329 |
| Swiss | 45.9 /100 | #182 | Average $46,315 |
| French | 45.2 /100 | #183 | Average $46,296 |
| Immigrants | Kenya | 42.4 /100 | #184 | Average $46,214 |
| Uruguayans | 41.6 /100 | #185 | Average $46,190 |
| Vietnamese | 40.9 /100 | #186 | Average $46,172 |
| Iraqis | 39.9 /100 | #187 | Fair $46,140 |
| Immigrants | Armenia | 38.3 /100 | #188 | Fair $46,094 |
| Spaniards | 37.2 /100 | #189 | Fair $46,059 |
| French Canadians | 36.1 /100 | #190 | Fair $46,026 |