Guyanese vs French Median Earnings
COMPARE
Guyanese
French
Median Earnings
Median Earnings Comparison
Guyanese
French
$45,470
MEDIAN EARNINGS
20.6/ 100
METRIC RATING
216th/ 347
METRIC RANK
$46,296
MEDIAN EARNINGS
45.2/ 100
METRIC RATING
183rd/ 347
METRIC RANK
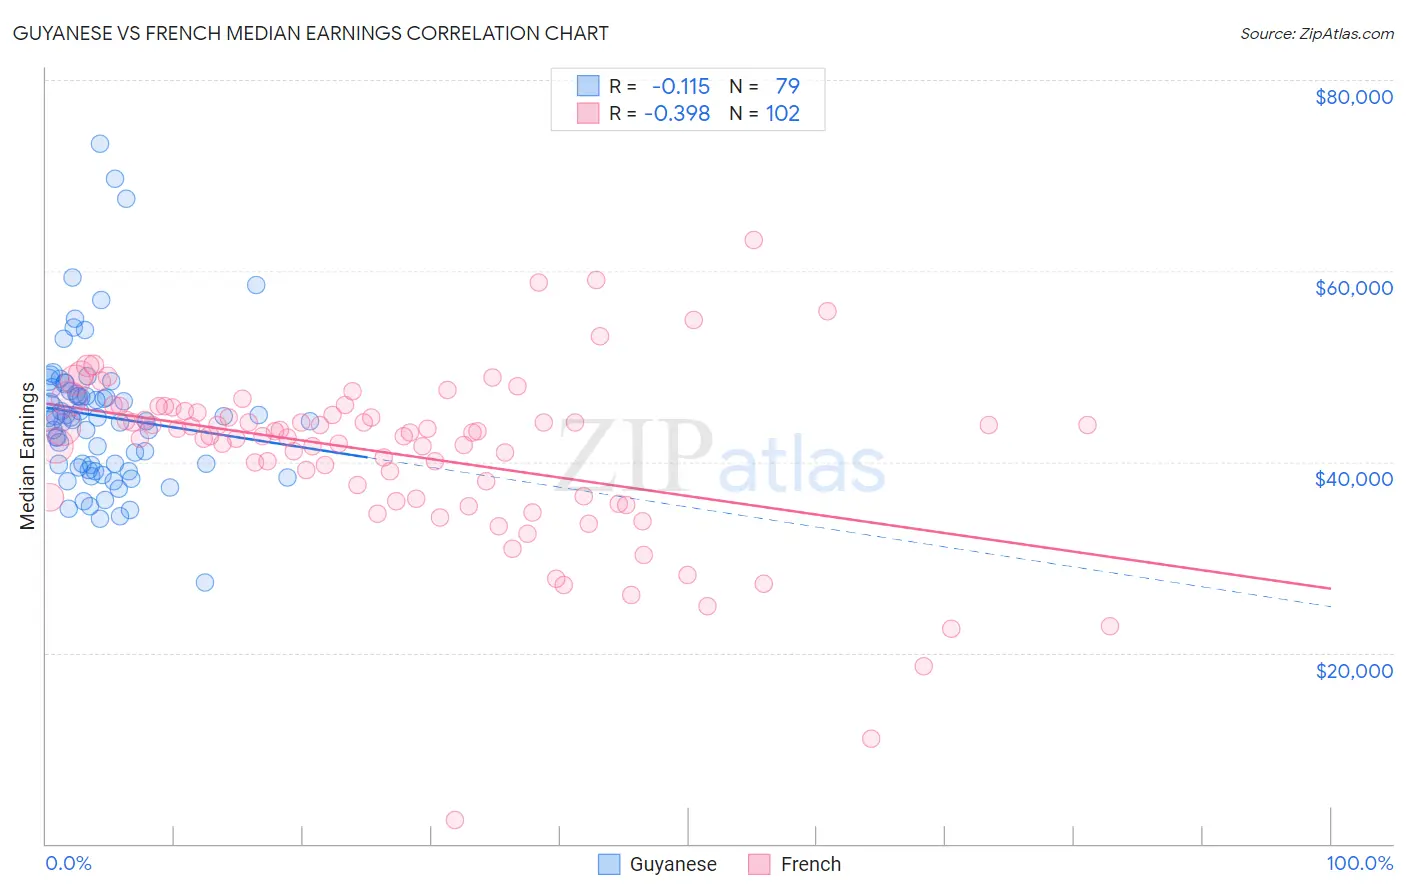
Guyanese vs French Median Earnings Correlation Chart
The statistical analysis conducted on geographies consisting of 176,931,599 people shows a poor negative correlation between the proportion of Guyanese and median earnings in the United States with a correlation coefficient (R) of -0.115 and weighted average of $45,470. Similarly, the statistical analysis conducted on geographies consisting of 572,035,046 people shows a mild negative correlation between the proportion of French and median earnings in the United States with a correlation coefficient (R) of -0.398 and weighted average of $46,296, a difference of 1.8%.
Median Earnings Correlation Summary
| Measurement | Guyanese | French |
| Minimum | $27,391 | $2,499 |
| Maximum | $73,355 | $63,271 |
| Range | $45,964 | $60,772 |
| Mean | $44,767 | $40,779 |
| Median | $44,635 | $42,886 |
| Interquartile 25% (IQ1) | $39,355 | $36,330 |
| Interquartile 75% (IQ3) | $47,401 | $45,125 |
| Interquartile Range (IQR) | $8,047 | $8,794 |
| Standard Deviation (Sample) | $7,735 | $9,085 |
| Standard Deviation (Population) | $7,686 | $9,040 |
Similar Demographics by Median Earnings
Demographics Similar to Guyanese by Median Earnings
In terms of median earnings, the demographic groups most similar to Guyanese are Tlingit-Haida ($45,468, a difference of 0.0%), Spanish ($45,432, a difference of 0.080%), Nigerian ($45,532, a difference of 0.14%), Immigrants from Bangladesh ($45,532, a difference of 0.14%), and Immigrants from Colombia ($45,550, a difference of 0.17%).
| Demographics | Rating | Rank | Median Earnings |
| Immigrants | Thailand | 23.7 /100 | #209 | Fair $45,598 |
| Immigrants | Grenada | 23.6 /100 | #210 | Fair $45,596 |
| Panamanians | 23.5 /100 | #211 | Fair $45,593 |
| Bermudans | 23.5 /100 | #212 | Fair $45,593 |
| Immigrants | Colombia | 22.4 /100 | #213 | Fair $45,550 |
| Nigerians | 22.0 /100 | #214 | Fair $45,532 |
| Immigrants | Bangladesh | 22.0 /100 | #215 | Fair $45,532 |
| Guyanese | 20.6 /100 | #216 | Fair $45,470 |
| Tlingit-Haida | 20.5 /100 | #217 | Fair $45,468 |
| Spanish | 19.7 /100 | #218 | Poor $45,432 |
| Dutch | 18.4 /100 | #219 | Poor $45,370 |
| Ecuadorians | 15.3 /100 | #220 | Poor $45,214 |
| Immigrants | Guyana | 15.1 /100 | #221 | Poor $45,204 |
| Immigrants | Panama | 15.0 /100 | #222 | Poor $45,198 |
| Whites/Caucasians | 15.0 /100 | #223 | Poor $45,197 |
Demographics Similar to French by Median Earnings
In terms of median earnings, the demographic groups most similar to French are Swiss ($46,315, a difference of 0.040%), Immigrants from Cameroon ($46,329, a difference of 0.070%), English ($46,334, a difference of 0.080%), Puget Sound Salish ($46,333, a difference of 0.080%), and Colombian ($46,349, a difference of 0.12%).
| Demographics | Rating | Rank | Median Earnings |
| Danes | 48.6 /100 | #176 | Average $46,392 |
| Belgians | 48.0 /100 | #177 | Average $46,375 |
| Colombians | 47.1 /100 | #178 | Average $46,349 |
| English | 46.5 /100 | #179 | Average $46,334 |
| Puget Sound Salish | 46.5 /100 | #180 | Average $46,333 |
| Immigrants | Cameroon | 46.4 /100 | #181 | Average $46,329 |
| Swiss | 45.9 /100 | #182 | Average $46,315 |
| French | 45.2 /100 | #183 | Average $46,296 |
| Immigrants | Kenya | 42.4 /100 | #184 | Average $46,214 |
| Uruguayans | 41.6 /100 | #185 | Average $46,190 |
| Vietnamese | 40.9 /100 | #186 | Average $46,172 |
| Iraqis | 39.9 /100 | #187 | Fair $46,140 |
| Immigrants | Armenia | 38.3 /100 | #188 | Fair $46,094 |
| Spaniards | 37.2 /100 | #189 | Fair $46,059 |
| French Canadians | 36.1 /100 | #190 | Fair $46,026 |