Immigrants from Venezuela vs French Cognitive Disability
COMPARE
Immigrants from Venezuela
French
Cognitive Disability
Cognitive Disability Comparison
Immigrants from Venezuela
French
16.5%
COGNITIVE DISABILITY
99.7/ 100
METRIC RATING
55th/ 347
METRIC RANK
17.0%
COGNITIVE DISABILITY
90.0/ 100
METRIC RATING
139th/ 347
METRIC RANK
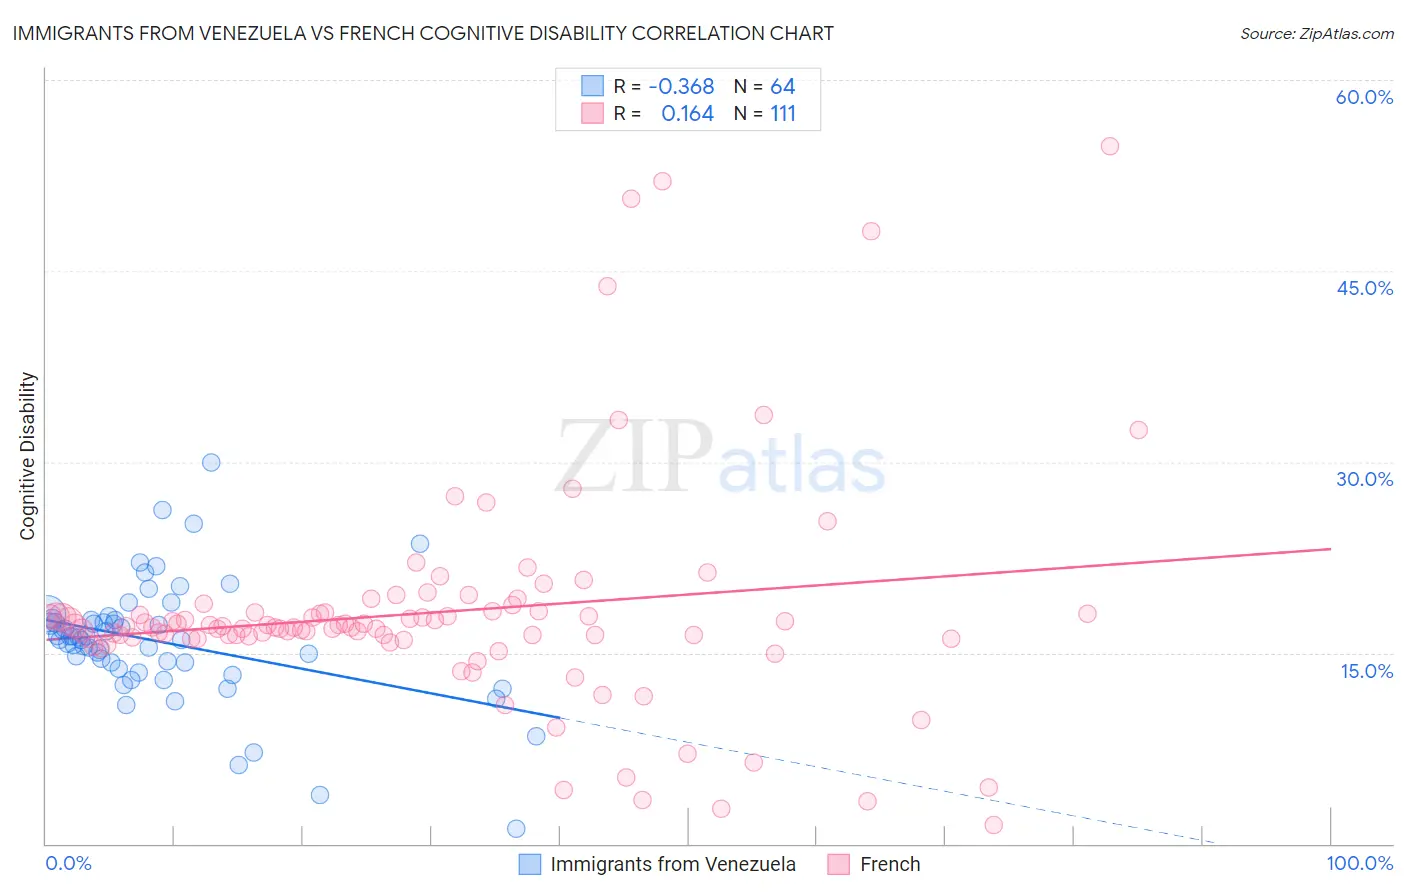
Immigrants from Venezuela vs French Cognitive Disability Correlation Chart
The statistical analysis conducted on geographies consisting of 287,845,766 people shows a mild negative correlation between the proportion of Immigrants from Venezuela and percentage of population with cognitive disability in the United States with a correlation coefficient (R) of -0.368 and weighted average of 16.5%. Similarly, the statistical analysis conducted on geographies consisting of 572,255,575 people shows a poor positive correlation between the proportion of French and percentage of population with cognitive disability in the United States with a correlation coefficient (R) of 0.164 and weighted average of 17.0%, a difference of 2.8%.
Cognitive Disability Correlation Summary
| Measurement | Immigrants from Venezuela | French |
| Minimum | 1.2% | 1.5% |
| Maximum | 30.0% | 54.8% |
| Range | 28.8% | 53.3% |
| Mean | 15.9% | 18.2% |
| Median | 16.1% | 17.0% |
| Interquartile 25% (IQ1) | 14.0% | 16.1% |
| Interquartile 75% (IQ3) | 17.6% | 18.2% |
| Interquartile Range (IQR) | 3.6% | 2.1% |
| Standard Deviation (Sample) | 4.7% | 8.8% |
| Standard Deviation (Population) | 4.7% | 8.7% |
Similar Demographics by Cognitive Disability
Demographics Similar to Immigrants from Venezuela by Cognitive Disability
In terms of cognitive disability, the demographic groups most similar to Immigrants from Venezuela are Immigrants from Iran (16.5%, a difference of 0.090%), Austrian (16.6%, a difference of 0.090%), Bhutanese (16.6%, a difference of 0.10%), Swedish (16.5%, a difference of 0.13%), and Pennsylvania German (16.6%, a difference of 0.17%).
| Demographics | Rating | Rank | Cognitive Disability |
| Immigrants | North America | 99.8 /100 | #48 | Exceptional 16.5% |
| Iranians | 99.8 /100 | #49 | Exceptional 16.5% |
| Norwegians | 99.8 /100 | #50 | Exceptional 16.5% |
| Immigrants | Korea | 99.8 /100 | #51 | Exceptional 16.5% |
| Soviet Union | 99.8 /100 | #52 | Exceptional 16.5% |
| Swedes | 99.8 /100 | #53 | Exceptional 16.5% |
| Immigrants | Iran | 99.8 /100 | #54 | Exceptional 16.5% |
| Immigrants | Venezuela | 99.7 /100 | #55 | Exceptional 16.5% |
| Austrians | 99.7 /100 | #56 | Exceptional 16.6% |
| Bhutanese | 99.7 /100 | #57 | Exceptional 16.6% |
| Pennsylvania Germans | 99.7 /100 | #58 | Exceptional 16.6% |
| Immigrants | Peru | 99.7 /100 | #59 | Exceptional 16.6% |
| Romanians | 99.7 /100 | #60 | Exceptional 16.6% |
| Immigrants | England | 99.6 /100 | #61 | Exceptional 16.6% |
| Czechoslovakians | 99.6 /100 | #62 | Exceptional 16.6% |
Demographics Similar to French by Cognitive Disability
In terms of cognitive disability, the demographic groups most similar to French are Chilean (17.0%, a difference of 0.0%), Aleut (17.0%, a difference of 0.0%), Carpatho Rusyn (17.0%, a difference of 0.030%), British (17.0%, a difference of 0.050%), and Immigrants from Brazil (17.0%, a difference of 0.050%).
| Demographics | Rating | Rank | Cognitive Disability |
| Whites/Caucasians | 92.1 /100 | #132 | Exceptional 17.0% |
| Immigrants | Jordan | 91.9 /100 | #133 | Exceptional 17.0% |
| Immigrants | Chile | 91.7 /100 | #134 | Exceptional 17.0% |
| Lebanese | 91.3 /100 | #135 | Exceptional 17.0% |
| Israelis | 91.0 /100 | #136 | Exceptional 17.0% |
| Immigrants | Norway | 90.9 /100 | #137 | Exceptional 17.0% |
| Welsh | 90.8 /100 | #138 | Exceptional 17.0% |
| French | 90.0 /100 | #139 | Excellent 17.0% |
| Chileans | 89.9 /100 | #140 | Excellent 17.0% |
| Aleuts | 89.9 /100 | #141 | Excellent 17.0% |
| Carpatho Rusyns | 89.6 /100 | #142 | Excellent 17.0% |
| British | 89.3 /100 | #143 | Excellent 17.0% |
| Immigrants | Brazil | 89.3 /100 | #144 | Excellent 17.0% |
| Immigrants | South Eastern Asia | 88.7 /100 | #145 | Excellent 17.0% |
| Costa Ricans | 88.0 /100 | #146 | Excellent 17.0% |