Immigrants from Venezuela vs Moroccan Median Earnings
COMPARE
Immigrants from Venezuela
Moroccan
Median Earnings
Median Earnings Comparison
Immigrants from Venezuela
Moroccans
$44,163
MEDIAN EARNINGS
4.0/ 100
METRIC RATING
242nd/ 347
METRIC RANK
$48,838
MEDIAN EARNINGS
96.7/ 100
METRIC RATING
114th/ 347
METRIC RANK
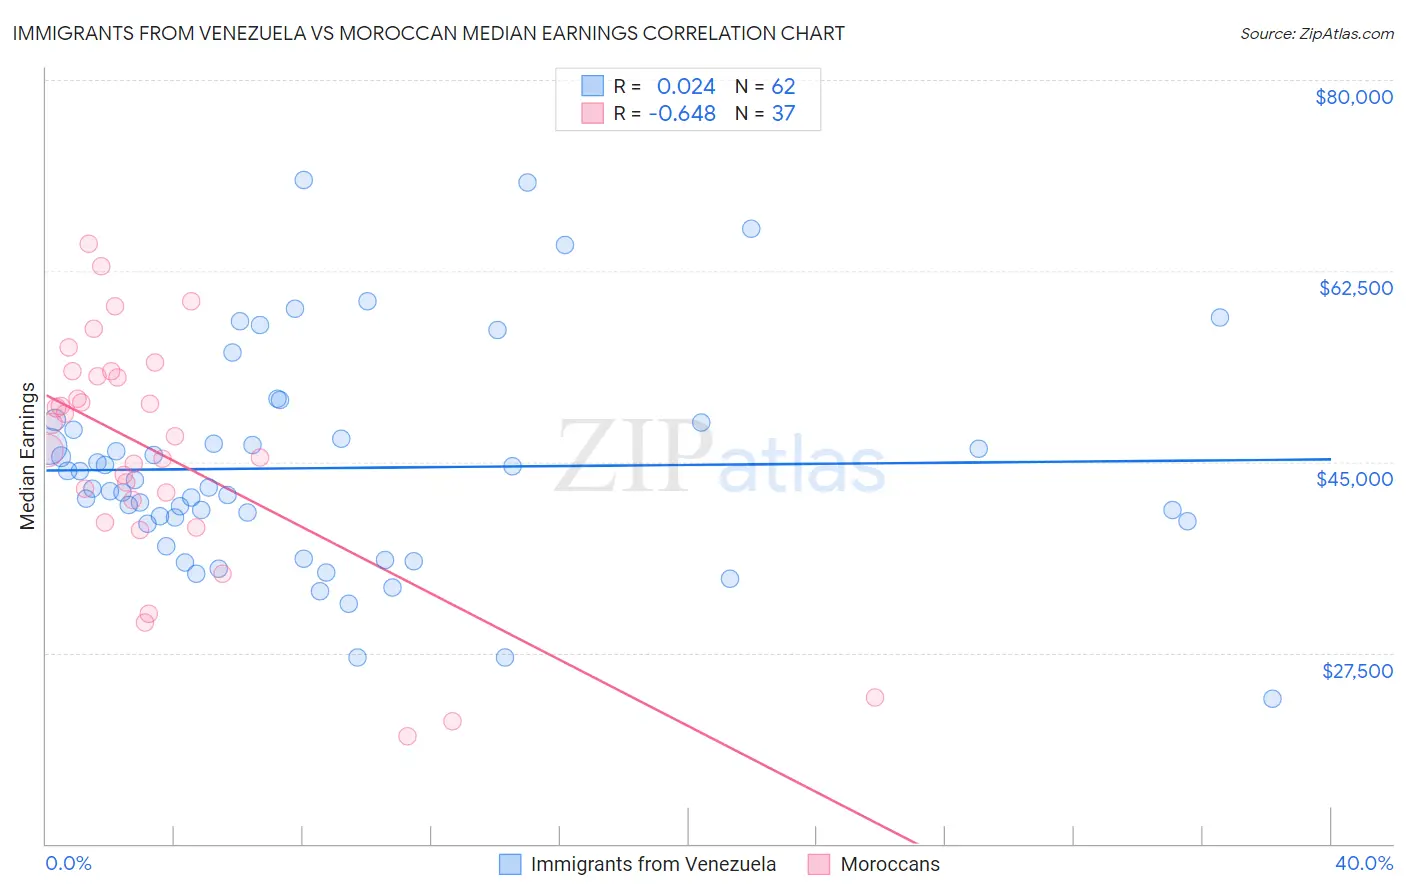
Immigrants from Venezuela vs Moroccan Median Earnings Correlation Chart
The statistical analysis conducted on geographies consisting of 287,839,546 people shows no correlation between the proportion of Immigrants from Venezuela and median earnings in the United States with a correlation coefficient (R) of 0.024 and weighted average of $44,163. Similarly, the statistical analysis conducted on geographies consisting of 201,800,770 people shows a significant negative correlation between the proportion of Moroccans and median earnings in the United States with a correlation coefficient (R) of -0.648 and weighted average of $48,838, a difference of 10.6%.
Median Earnings Correlation Summary
| Measurement | Immigrants from Venezuela | Moroccan |
| Minimum | $23,314 | $19,886 |
| Maximum | $70,871 | $64,979 |
| Range | $47,557 | $45,093 |
| Mean | $44,436 | $45,820 |
| Median | $42,584 | $47,333 |
| Interquartile 25% (IQ1) | $39,305 | $40,473 |
| Interquartile 75% (IQ3) | $47,920 | $53,052 |
| Interquartile Range (IQR) | $8,616 | $12,578 |
| Standard Deviation (Sample) | $9,975 | $10,819 |
| Standard Deviation (Population) | $9,895 | $10,672 |
Similar Demographics by Median Earnings
Demographics Similar to Immigrants from Venezuela by Median Earnings
In terms of median earnings, the demographic groups most similar to Immigrants from Venezuela are Samoan ($44,206, a difference of 0.10%), Subsaharan African ($44,118, a difference of 0.10%), Nonimmigrants ($44,117, a difference of 0.10%), Aleut ($44,241, a difference of 0.18%), and Immigrants from Burma/Myanmar ($43,998, a difference of 0.37%).
| Demographics | Rating | Rank | Median Earnings |
| Venezuelans | 6.9 /100 | #235 | Tragic $44,580 |
| British West Indians | 6.7 /100 | #236 | Tragic $44,552 |
| Immigrants | Ecuador | 5.9 /100 | #237 | Tragic $44,462 |
| Sudanese | 5.6 /100 | #238 | Tragic $44,419 |
| Senegalese | 5.3 /100 | #239 | Tragic $44,373 |
| Aleuts | 4.4 /100 | #240 | Tragic $44,241 |
| Samoans | 4.2 /100 | #241 | Tragic $44,206 |
| Immigrants | Venezuela | 4.0 /100 | #242 | Tragic $44,163 |
| Sub-Saharan Africans | 3.7 /100 | #243 | Tragic $44,118 |
| Immigrants | Nonimmigrants | 3.7 /100 | #244 | Tragic $44,117 |
| Immigrants | Burma/Myanmar | 3.2 /100 | #245 | Tragic $43,998 |
| Immigrants | West Indies | 3.1 /100 | #246 | Tragic $43,989 |
| Immigrants | Cabo Verde | 3.0 /100 | #247 | Tragic $43,963 |
| Nepalese | 2.6 /100 | #248 | Tragic $43,860 |
| Malaysians | 2.6 /100 | #249 | Tragic $43,844 |
Demographics Similar to Moroccans by Median Earnings
In terms of median earnings, the demographic groups most similar to Moroccans are Chinese ($48,836, a difference of 0.010%), Immigrants from Kuwait ($48,861, a difference of 0.050%), Northern European ($48,887, a difference of 0.10%), Immigrants from Zimbabwe ($48,913, a difference of 0.15%), and Immigrants from Ethiopia ($48,924, a difference of 0.17%).
| Demographics | Rating | Rank | Median Earnings |
| Immigrants | Morocco | 98.4 /100 | #107 | Exceptional $49,368 |
| Palestinians | 98.0 /100 | #108 | Exceptional $49,209 |
| Syrians | 97.1 /100 | #109 | Exceptional $48,934 |
| Immigrants | Ethiopia | 97.1 /100 | #110 | Exceptional $48,924 |
| Immigrants | Zimbabwe | 97.0 /100 | #111 | Exceptional $48,913 |
| Northern Europeans | 96.9 /100 | #112 | Exceptional $48,887 |
| Immigrants | Kuwait | 96.8 /100 | #113 | Exceptional $48,861 |
| Moroccans | 96.7 /100 | #114 | Exceptional $48,838 |
| Chinese | 96.7 /100 | #115 | Exceptional $48,836 |
| Koreans | 96.2 /100 | #116 | Exceptional $48,727 |
| Serbians | 95.9 /100 | #117 | Exceptional $48,677 |
| Immigrants | Jordan | 95.9 /100 | #118 | Exceptional $48,673 |
| Poles | 95.8 /100 | #119 | Exceptional $48,659 |
| Carpatho Rusyns | 95.5 /100 | #120 | Exceptional $48,617 |
| Arabs | 95.4 /100 | #121 | Exceptional $48,599 |