Immigrants from Venezuela vs Paraguayan Median Earnings
COMPARE
Immigrants from Venezuela
Paraguayan
Median Earnings
Median Earnings Comparison
Immigrants from Venezuela
Paraguayans
$44,163
MEDIAN EARNINGS
4.0/ 100
METRIC RATING
242nd/ 347
METRIC RANK
$51,068
MEDIAN EARNINGS
99.9/ 100
METRIC RATING
68th/ 347
METRIC RANK
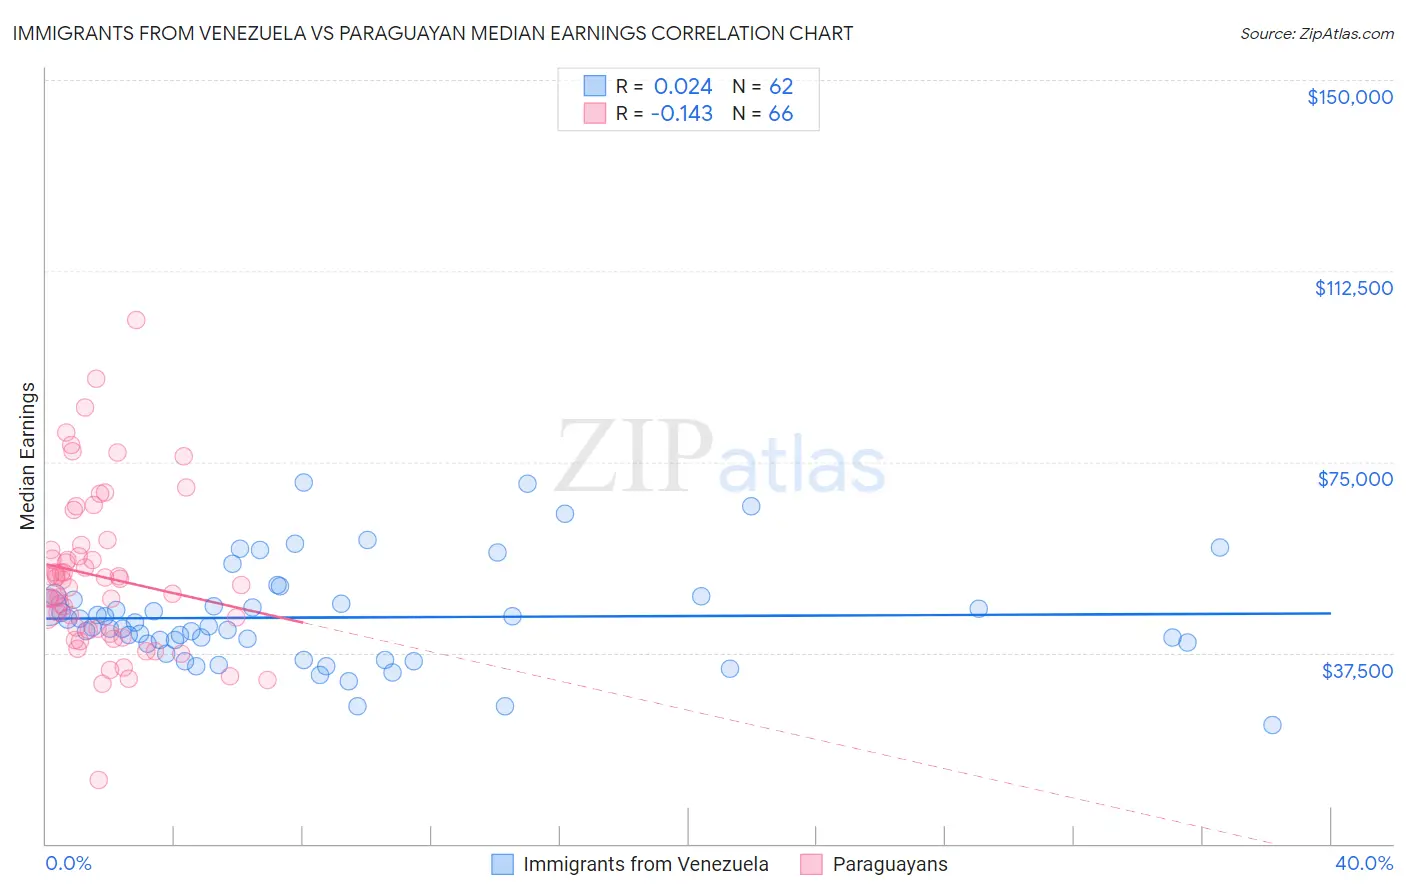
Immigrants from Venezuela vs Paraguayan Median Earnings Correlation Chart
The statistical analysis conducted on geographies consisting of 287,839,546 people shows no correlation between the proportion of Immigrants from Venezuela and median earnings in the United States with a correlation coefficient (R) of 0.024 and weighted average of $44,163. Similarly, the statistical analysis conducted on geographies consisting of 95,085,692 people shows a poor negative correlation between the proportion of Paraguayans and median earnings in the United States with a correlation coefficient (R) of -0.143 and weighted average of $51,068, a difference of 15.6%.
Median Earnings Correlation Summary
| Measurement | Immigrants from Venezuela | Paraguayan |
| Minimum | $23,314 | $12,403 |
| Maximum | $70,871 | $102,750 |
| Range | $47,557 | $90,347 |
| Mean | $44,436 | $52,505 |
| Median | $42,584 | $51,405 |
| Interquartile 25% (IQ1) | $39,305 | $42,088 |
| Interquartile 75% (IQ3) | $47,920 | $57,643 |
| Interquartile Range (IQR) | $8,616 | $15,555 |
| Standard Deviation (Sample) | $9,975 | $15,766 |
| Standard Deviation (Population) | $9,895 | $15,646 |
Similar Demographics by Median Earnings
Demographics Similar to Immigrants from Venezuela by Median Earnings
In terms of median earnings, the demographic groups most similar to Immigrants from Venezuela are Samoan ($44,206, a difference of 0.10%), Subsaharan African ($44,118, a difference of 0.10%), Nonimmigrants ($44,117, a difference of 0.10%), Aleut ($44,241, a difference of 0.18%), and Immigrants from Burma/Myanmar ($43,998, a difference of 0.37%).
| Demographics | Rating | Rank | Median Earnings |
| Venezuelans | 6.9 /100 | #235 | Tragic $44,580 |
| British West Indians | 6.7 /100 | #236 | Tragic $44,552 |
| Immigrants | Ecuador | 5.9 /100 | #237 | Tragic $44,462 |
| Sudanese | 5.6 /100 | #238 | Tragic $44,419 |
| Senegalese | 5.3 /100 | #239 | Tragic $44,373 |
| Aleuts | 4.4 /100 | #240 | Tragic $44,241 |
| Samoans | 4.2 /100 | #241 | Tragic $44,206 |
| Immigrants | Venezuela | 4.0 /100 | #242 | Tragic $44,163 |
| Sub-Saharan Africans | 3.7 /100 | #243 | Tragic $44,118 |
| Immigrants | Nonimmigrants | 3.7 /100 | #244 | Tragic $44,117 |
| Immigrants | Burma/Myanmar | 3.2 /100 | #245 | Tragic $43,998 |
| Immigrants | West Indies | 3.1 /100 | #246 | Tragic $43,989 |
| Immigrants | Cabo Verde | 3.0 /100 | #247 | Tragic $43,963 |
| Nepalese | 2.6 /100 | #248 | Tragic $43,860 |
| Malaysians | 2.6 /100 | #249 | Tragic $43,844 |
Demographics Similar to Paraguayans by Median Earnings
In terms of median earnings, the demographic groups most similar to Paraguayans are Immigrants from Spain ($51,092, a difference of 0.050%), Mongolian ($51,038, a difference of 0.060%), Afghan ($51,112, a difference of 0.090%), Lithuanian ($50,991, a difference of 0.15%), and Immigrants from Ukraine ($50,984, a difference of 0.16%).
| Demographics | Rating | Rank | Median Earnings |
| Immigrants | Latvia | 99.9 /100 | #61 | Exceptional $51,555 |
| Immigrants | Romania | 99.9 /100 | #62 | Exceptional $51,337 |
| Immigrants | Bulgaria | 99.9 /100 | #63 | Exceptional $51,318 |
| New Zealanders | 99.9 /100 | #64 | Exceptional $51,246 |
| Greeks | 99.9 /100 | #65 | Exceptional $51,164 |
| Afghans | 99.9 /100 | #66 | Exceptional $51,112 |
| Immigrants | Spain | 99.9 /100 | #67 | Exceptional $51,092 |
| Paraguayans | 99.9 /100 | #68 | Exceptional $51,068 |
| Mongolians | 99.8 /100 | #69 | Exceptional $51,038 |
| Lithuanians | 99.8 /100 | #70 | Exceptional $50,991 |
| Immigrants | Ukraine | 99.8 /100 | #71 | Exceptional $50,984 |
| Immigrants | Egypt | 99.8 /100 | #72 | Exceptional $50,901 |
| Immigrants | Netherlands | 99.8 /100 | #73 | Exceptional $50,818 |
| South Africans | 99.8 /100 | #74 | Exceptional $50,752 |
| Immigrants | Scotland | 99.8 /100 | #75 | Exceptional $50,741 |